Why does Pirates of the Caribbean rarely exceed 20 minutes of queue even though everyone wants to ride it, while Peter Pan’s Flight hits 60 minutes practically every day? Why does Crush’s Coaster, one of the smallest attractions in the resort, have the longest queues?
The answer isn’t popularity. It’s math.
Every attraction at Disneyland Paris has a fixed technical capacity: the maximum number of people it can move in one hour under optimal conditions. That number, combined with the level of demand the attraction generates, determines whether the queue flows or jams. And the difference between an attraction that moves 4,500 people per hour and one that moves 800 explains almost everything you see in the park.
This article has two parts: the complete capacity list for both parks, and the analysis of why those numbers matter more than you’d think.
⚠️ Methodological note: Disney does not publish official capacity figures for its attractions. The data in this article comes from technical calculations based on the number of vehicles, their capacity, cycle duration, and the number of simultaneous units in operation, cross-checked with data from specialized researchers. Attractions that opened in 2025-2026 include estimates based on their technology and loading system. These are approximate figures, not official numbers.
How attraction capacity is calculated
The base formula is simple:
Capacity/hour = (People per vehicle × Number of simultaneous vehicles) ÷ Cycle duration (in hours)
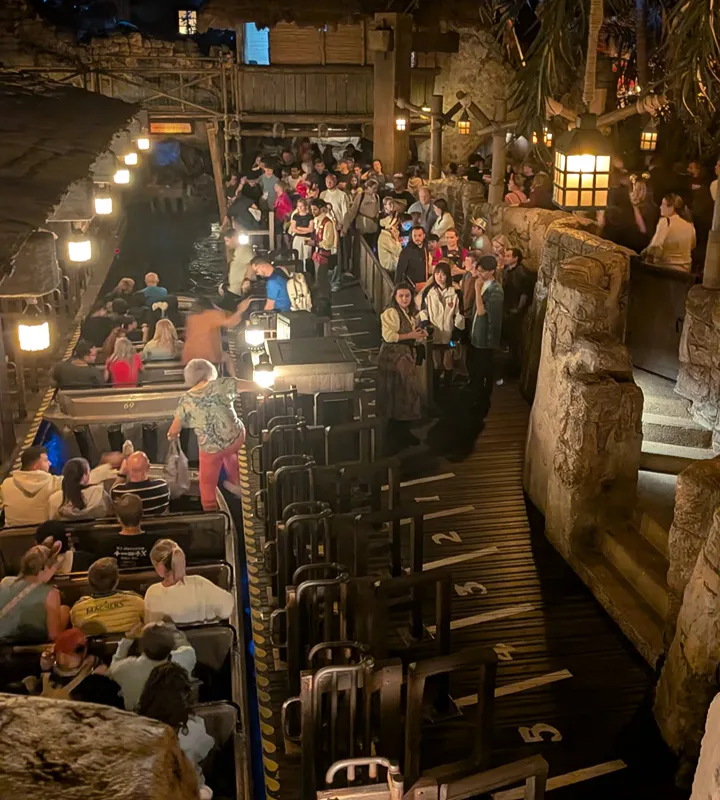
A concrete example: Pirates of the Caribbean has 40-person boats that depart roughly every 30 seconds. In one hour, about 120 boats × 40 people = ~4,800 people can move through. The continuous chain of vehicles is what keeps the queue flowing almost non-stop.
At the opposite end, Crush’s Coaster has 4-person shells with a slow loading cycle. The math result is about 800 people per hour, less than one-fifth of Pirates. With equal demand, Crush’s queue takes five times longer to move.
🏰 Parc Disneyland — Hourly capacity
The heavy lifters: attractions that absorb crowds
| Attraction | Est. capacity/hour | Typical queue level |
|---|---|---|
| 🏴☠️ Pirates of the Caribbean | ~4,500 | 🟢 Low — rarely >30 min |
| 👻 Phantom Manor | ~3,400 | 🟢 Low — rarely >25 min |
| 🌍 It’s a Small World | ~3,200 | 🟢 Low — rarely >20 min |
| 🎠 Le Carrousel de Lancelot | ~2,200 | 🟢 Very low |
| 🏔️ Big Thunder Mountain | ~2,100 | 🟡 Moderate — 30-50 min at peak |
| 🏎️ Indiana Jones et le Temple du Péril | ~2,100 | 🟡 Moderate — 40-60 min at peak |
| 🎪 Les Voyages de Pinocchio | ~2,100 | 🟢 Low |
| ⚡ Hyperspace Mountain | ~1,800 | 🟡 Moderate — 30-60 min at peak |
| 🚀 Star Tours | ~1,700 | 🟡 Moderate |
| ☕ Mad Hatter’s Tea Cups | ~1,700 | 🟢 Low |
| 🚀 Buzz Lightyear Laser Blast | ~1,400 | 🟡 Moderate |
| 🌊 Blanche Neige et les Sept Nains | ~1,400 | 🟡 Moderate |
| 🚂 Casey Jr. — Le Petit Train du Cirque | ~1,350 | 🟢 Low |
| 🚗 Autopia | ~1,600 | 🟢 Low-moderate |
| 🧚 Peter Pan’s Flight | ~1,200 | 🔴 High (50-80 min almost always) |
| 🌊 Le Pays des Contes de Fées | ~850 | 🟢 Low (low demand too) |
| 🐘 Dumbo the Flying Elephant | ~950 | 🟡 Moderate |
| 🪐 Orbitron | ~720 | 🔴 High (moderate demand) |
No significant capacity (walk-through experiences):
- Alice’s Curious Labyrinth
- Les Mystères du Nautilus
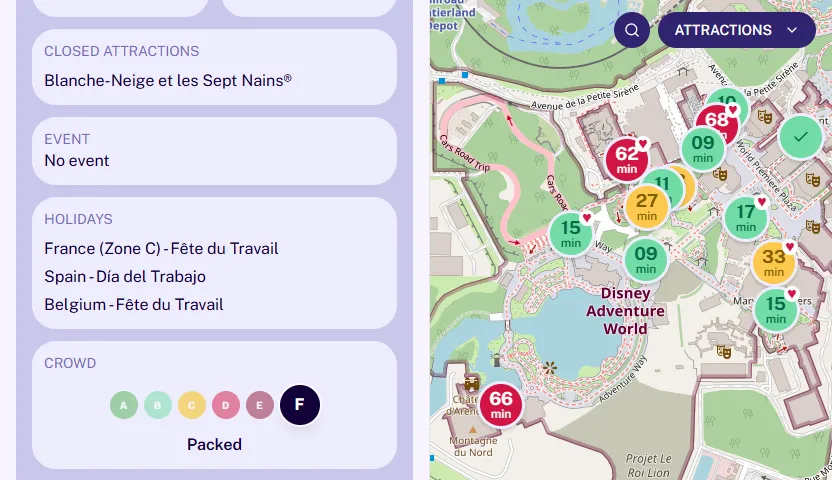
📊 Capacity is only half the equation. With MagicWait Paris you see the real result of the capacity/demand formula in real time: wait times for every attraction, updated by the minute. Start free and plan with data, not intuition.
🎬 Disney Adventure World — Hourly capacity
The new and the veteran
| Attraction | Est. capacity/hour | Typical queue level |
|---|---|---|
| 🐀 Ratatouille: L’Aventure | ~1,800 | 🟡 Moderate — 40-70 min at peak |
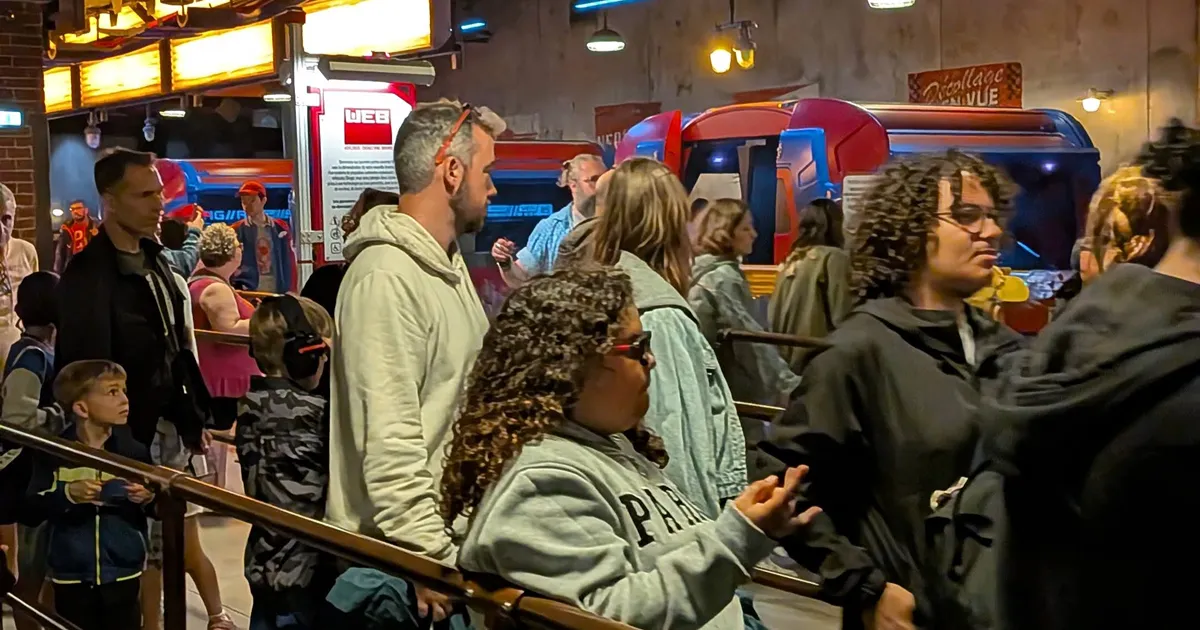
| 🕷️ Spider-Man W.E.B. Adventure | ~1,600 | 🔴 High — 50-70 min at peak |
| 🦾 Avengers Assemble: Flight Force | ~1,400 | 🟢 Low-moderate |
| 🚗 Cars Quatre Roues Rallye | ~1,100 | 🟢 Low-moderate |
| 🌀 Rapunzel Tangled Spin | ~1,100 | 🟢 Low |
| ❄️ Frozen Ever After | ~1,200 | 🔴 High — 70-100 min almost always |
| 🪂 Toy Soldiers Parachute Drop | ~800 | 🟡 Moderate (moderate demand) |
| 🐕 Slinky Dog Zigzag Spin | ~900 | 🟡 Moderate |
| 🏎️ RC Racer | ~900 | 🟡 Moderate |
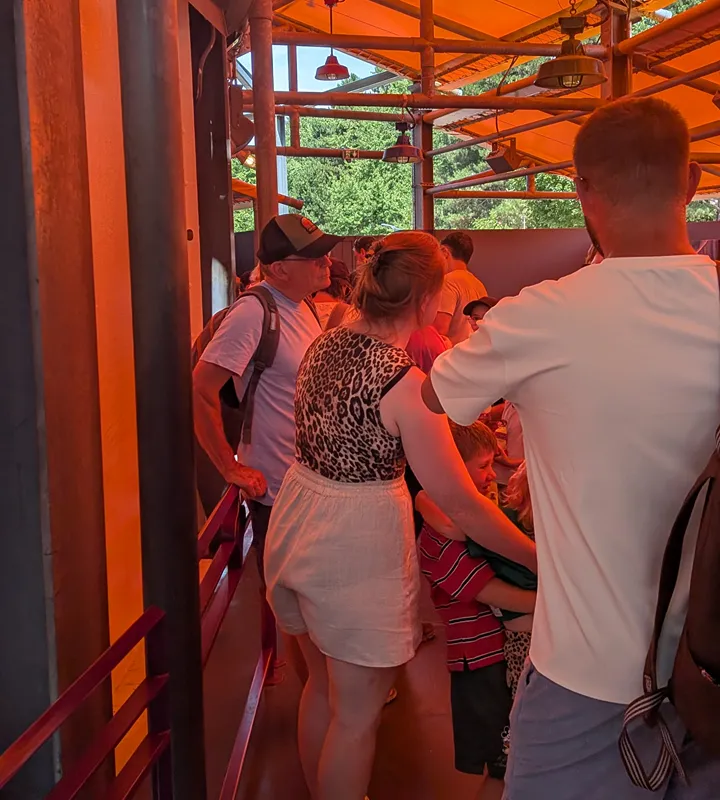
| 🐢 Crush’s Coaster | ~800 | 🔴🔴 Very high — 60-100 min all day |
The table that explains everything: demand vs. capacity
Queue length doesn’t depend on how popular an attraction is. It depends on whether its capacity can absorb that popularity. Here’s the real equation:
| Attraction | Capacity/hour | Demand | Result |
|---|---|---|---|
| Pirates of the Caribbean | ~4,500 | ⭐⭐⭐⭐ Very high | ✅ Capacity absorbs demand |
| Phantom Manor | ~3,400 | ⭐⭐⭐ High | ✅ Capacity absorbs demand |
| It’s a Small World | ~3,200 | ⭐⭐⭐ High | ✅ Capacity absorbs demand |
| Big Thunder Mountain | ~2,100 | ⭐⭐⭐⭐ Very high | 🟡 Fair balance — moderate queue |
| Hyperspace Mountain | ~1,800 | ⭐⭐⭐⭐ Very high | 🟡 Fair balance — moderate queue |
| Ratatouille | ~1,800 | ⭐⭐⭐⭐ Very high | 🟡 Fair balance — moderate queue |
| Spider-Man W.E.B. | ~1,600 | ⭐⭐⭐⭐ Very high | 🔴 Demand exceeds capacity |
| Peter Pan’s Flight | ~1,200 | ⭐⭐⭐⭐⭐ Extremely high | 🔴🔴 Structural imbalance |
| Frozen Ever After | ~1,200 | ⭐⭐⭐⭐⭐ Extremely high (new) | 🔴🔴 Structural imbalance |
| Crush’s Coaster | ~800 | ⭐⭐⭐⭐⭐ Extremely high | 🔴🔴🔴 Worst imbalance in the resort |
The three most revealing cases
🏴☠️ Pirates vs. 🧚 Peter Pan: same fame, completely different queue
This is the most instructive comparison in Parc Disneyland. Two classic attractions, two of the most beloved in the park, with similar demand levels. But Pirates moves ~4,500 people per hour and Peter Pan barely ~1,200.
The reason is the vehicle type. Pirates uses 40-person boats in a continuous chain, departing every 30 seconds without stopping. Peter Pan uses individual 4-person vehicles that leave one at a time with a slower loading cycle. With equal demand, Pirates moves almost four times more visitors per hour.
The structural solution for Peter Pan would require redesigning the entire attraction, something Disney has deliberately ruled out to preserve its original 1983 character. The consequence is a queue that only drops noticeably during the parade, when some demand shifts to Main Street, and at the end of the day, now that its hours have been extended.
The strategy that works: Peter Pan during the 30-40 minutes of the Disney Stars on Parade. It’s the only window of the day when its queue drops consistently and predictably.
❄️ Frozen Ever After: high demand + low capacity = the perfect storm
At ~1,200 people per hour, Frozen Ever After has similar capacity to Peter Pan. But its demand in 2026 is significantly higher because it’s new, it’s the headline attraction of World of Frozen, and it concentrates the flow of the entire land from opening.
Capacity is limited by the boat size (16 people) and the cycle duration (over 5 minutes of track time plus loading and unloading time). There’s no way to increase it without physically changing the vehicles or the track.
The 2026 novelty effect will diminish over time, as happened with Ratatouille, which took several years to stabilize its queues. But for now, Frozen Ever After is the attraction with the most unbalanced demand-to-capacity ratio in the resort.
The strategy that works: park opening (the first 15-20 minutes) or the final stretch of the day, when some of the flow shifts toward Adventure Bay for the nighttime show.
🐢 Crush’s Coaster: the most extreme case mathematically
At ~800 people per hour, Crush’s Coaster has the lowest capacity among high-demand attractions in the entire resort. And its demand is among the highest.
The problem is structural and unsolvable without a major overhaul: 4 people per shell is the original design limit. Only 11 shells are in circulation and the full cycle (loading, ride, unloading) takes several minutes per unit.
The consequence is pure arithmetic: if at any given moment there are 500 people in the queue and the attraction moves ~800 per hour, the actual wait time is about 37 minutes under ideal conditions, not counting technical breakdowns that reduce effective operating capacity. In practice, with closures and demand peaks, the queue rarely drops below 60 minutes during core hours.
The refurbishment planned for September 2026, closing until summer 2027, is exactly Disney’s response to this imbalance. The expectation is that the renovation will address the loading system to improve effective capacity.
The strategy that works until then: Single Rider (reduces the impact of low capacity by filling empty seats) or Extra Magic Time if you’re staying at a Disney hotel.
Why continuous-chain attractions are the most efficient
The clearest pattern in the list is this: the attractions with the highest throughput are those with vehicles in continuous motion without stopping to load.
Pirates of the Caribbean, Phantom Manor, and It’s a Small World operate with a system where vehicles never come to a complete stop: visitors get on and off while the vehicle moves slowly forward. That eliminates the dead time of stopping and starting, which in attractions with static loading can account for 30-40% of the total cycle time.
At the opposite end, attractions like Crush’s Coaster, RC Racer, or Toy Soldiers Parachute Drop have single vehicles that stop, load, complete the full cycle, and stop again. Every stop is lost time in capacity terms.
The practical takeaway: if you want to ride many attractions with short queues, prioritize continuous-chain rides (Pirates, Phantom Manor, Small World, Pinocchio) in the middle of the day when everything else is saturated. They absorb demand best even when full.
🎯 Capacity doesn’t change, but demand does. And you can see it. With MagicWait Paris you can check real-time wait times for every attraction in both parks and decide based on data, not intuition. Access it free and plan like a strategist.
How to use this information to plan your day
Hourly capacity doesn’t change from one day to the next. But demand does. And that’s where this table becomes a real planning tool.
Rule 1 — Low capacity, high demand: always first thing or at closing. Peter Pan, Frozen Ever After, Crush’s Coaster. These benefit most from the edges of the day when demand hasn’t yet peaked or has already started to drop.
Rule 2 — High capacity: any time of day. Pirates, Phantom Manor, It’s a Small World. You can go at any hour and the queue will be manageable because capacity absorbs the flow constantly.
Rule 3 — Medium capacity: use demand windows. Big Thunder Mountain during the parade or late in the day, Ratatouille early in the day, Spider-Man after 7pm. Their capacity is sufficient when demand drops, but insufficient at peak.
Rule 4 — Capacity doesn’t predict wait time, demand does. An attraction with 2,000 people/hour can have a 60-minute queue if 3,000 people are waiting. That’s why historical wait time data, which reflects actual demand in each time slot, is more useful than capacity for planning your day.
The summary in one sentence
The queue at an attraction doesn’t depend on how popular it is. It depends on whether its capacity can absorb that popularity. Pirates moves 4,500 people per hour and barely has a queue. Crush’s Coaster moves 800 and has the worst queue in the resort. The park you see isn’t random: it’s math applied to the experience.
Understanding that math is what lets you plan a day that doesn’t depend on luck.
Want to know the real-time wait for the attraction you want to ride right now? Check MagicWait Paris before every move and make decisions with data, not intuition.