Between 10:00 and 18:00, Big Thunder Mountain costs you 36.4 minutes more than the park median. At ten in the morning. At noon. At five in the afternoon. The figure barely moves: a deviation of 2.1 minutes across nine straight hours.
That means the question everyone asks, what time should I ride Big Thunder?, has no good answer within the park’s regular hours. There’s no gap. No usable dip. The overcost is flat.
We measured it over 40 consecutive days, from May 4 to June 12, 2026, with 6,158 wait-time readings for this attraction.
The data: what we measured and how
Two series, same time window:
- Big Thunder Mountain, posted wait time, 6,158 readings over 40 days.
- Park median, calculated across the attractions with data at each moment (an average of 33 attractions per day in this window).
We use the park median, not the mean, precisely because Big Thunder is the kind of attraction that distorts a mean. The median represents what a normal visitor finds when looking at the board: the central point of what’s available.
And from that comes the metric that really matters for planning a day: the overcost. Not how long you wait at Big Thunder in absolute terms, but how many extra minutes you pay for choosing it over what’s around you.
One methodological note worth saying before someone asks: throughout this window, the Frontierland Theater was closed for refurbishment. There were no performances of The Lion King: Rhythms of the Pride Lands on the measured dates. The curve below is Big Thunder without the biggest crowd-puller in its area running next door.
The full curve, hour by hour
| Time | Big Thunder (avg) | Park median | Overcost |
|---|---|---|---|
| 8:00 (Extra Magic Time) | 10 min | 5 min | +5 |
| 9:00 (Extra Magic Time) | 26 min | 5 min | +21 |
| 10:00 | 42 min | 5 min | +37 |
| 11:00 | 48 min | 15 min | +33 |
| 12:00 | 57 min | 20 min | +37 |
| 13:00 | 54 min | 20 min | +34 |
| 14:00 | 54 min | 15 min | +39 |
| 15:00 | 54 min | 15 min | +39 |
| 16:00 | 51 min | 15 min | +36 |
| 17:00 | 48 min | 10 min | +38 |
| 18:00 | 45 min | 10 min | +35 |
| 19:00 | 39 min | 5 min | +34 |
| 20:00 | 36 min | 5 min | +31 |
| 21:00 | 31 min | 5 min | +26 |
| 22:00 | 18 min | 5 min | +13 |
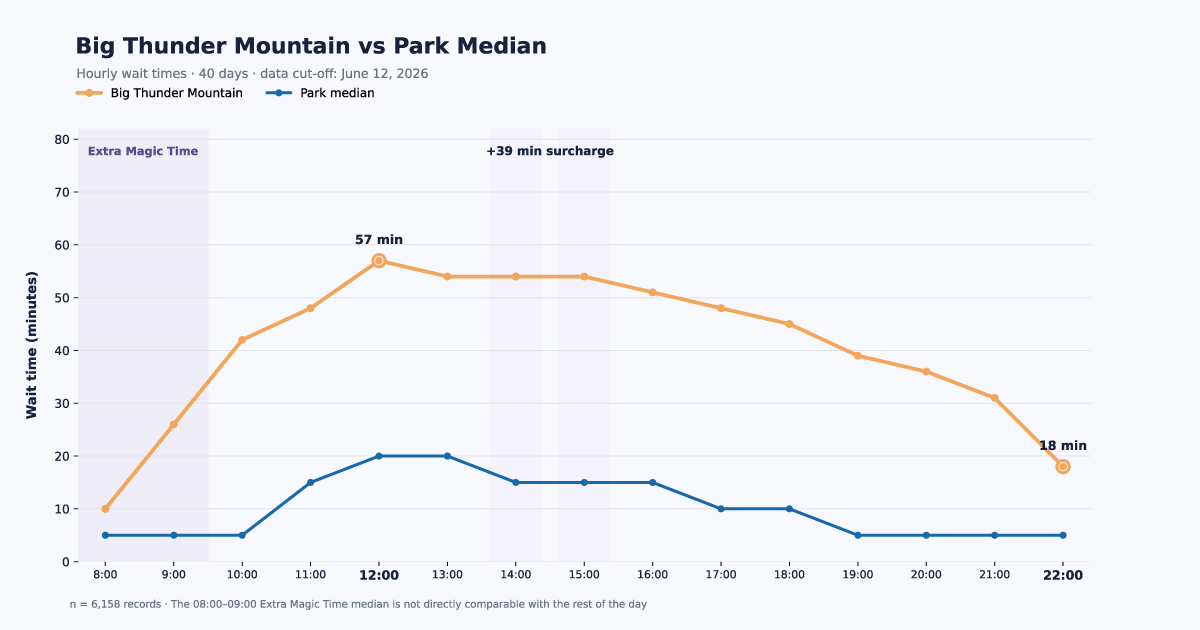
Big Thunder Mountain and the park median. n = 6,158 readings, 40 days. Cutoff: June 12, 2026. The first two rows correspond to the early-access window for Disney hotel guests, when only part of the park is open: the median for those hours is calculated over far fewer attractions and is not comparable with the rest of the table.
There are three things here worth stopping on.
First: the peak is at 12:00, not 15:00.
It’s easy to assume the critical stretch of the day is mid-afternoon, when everyone has finished lunch. Our own data says no. At 15:00 the attraction has already been three hours away from its peak. The park median tells the same story: 20 minutes at 12:00 and 13:00, and only 15 from 14:00 on.
The real hostile stretch is from 11:00 to 13:00. Anyone planning their break for three in the afternoon is late to their own strategy.
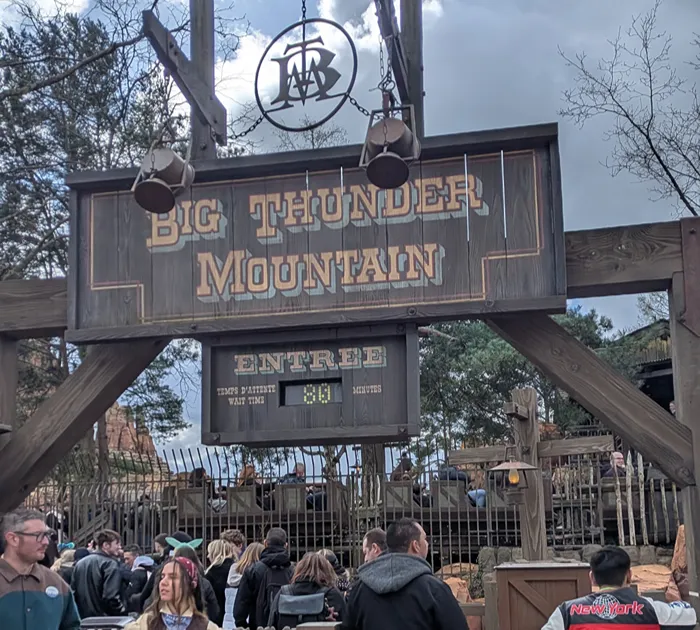
The Big Thunder queue mid-afternoon, the moment when the overcost has been at its peak for hours.
Second: the right-hand column is almost a straight line.
From 10:00 to 18:00, the overcost swings between 33 and 39 minutes. Nine hours. Average of 36.4, deviation of 2.1. Big Thunder goes up and down during the day, yes, but it goes up and down at the same time as everything else. When its queue drops at five in the afternoon, the rest of the park drops in the same proportion. The relative cost of choosing it doesn’t improve.
Keep in mind that spending 50 minutes in line when the rest of the park is at 10 minutes is not the same as spending 60 when the park average is 30. The cost in rides done is much higher. Why everything rises and falls at the same time is in how each attraction’s capacity is distributed by hour.
Third: the early-access window is another league.
At 8:30 Big Thunder posts a 10-minute average. At 10:00 it posts 42. The same attraction, two hours apart, 32 minutes of difference. No other time decision in the day has that size.
It’s worth being precise about what this means and what it doesn’t. The early-access window is only for Disney hotel guests, operates with part of the park open, and the 10-minute average itself includes days with peaks of up to 45. It’s not a nonexistent queue. But if you’re staying inside the resort and that hour is included in your stay, Big Thunder is one of the best things you can do with it, and it’s probably the strongest argument in favor of paying for a Disney hotel that comes out of this data. The full mechanics of the window are explained in our Extra Magic Time guide.
What this means for your day
If you have a single day and you’re going without small children, a couple, a group of adults, a family with older kids, your real constraint isn’t tiredness. It’s the clock. And in that case the approach changes completely.
Stop looking for the moment and decide the position. Big Thunder isn’t an attraction you slot in “when it drops.” It’s an attraction you place at the very start or the very end, because in the middle it always costs the same.
At 10:00 the attraction posts 42 minutes while the park median sits at 5. It’s the moment of the day when the disproportion is most brutal: more than eight times the median. Getting into that queue first thing means burning 42 minutes while attractions around you are at five. It’s mathematically the worst decision of your day, and it’s exactly what most people do when they walk in through Main Street.
At 22:00 it posts 18 minutes and the overcost drops to 13. It’s the only real window of the day. And it’s not a small one: that’s 24 minutes less overcost than at midday, on the same attraction, the same day.
The concrete decision: if the park closes late on your dates, Big Thunder goes at the end. Not mid-afternoon, not “when we pass through Frontierland.” At the end. And you spend the first hour of the day on the attractions that sit at 5 minutes and will be at 20 by noon. For the rest of the day plan with data, there’s our guide to saving two hours of queues at Disneyland Paris.
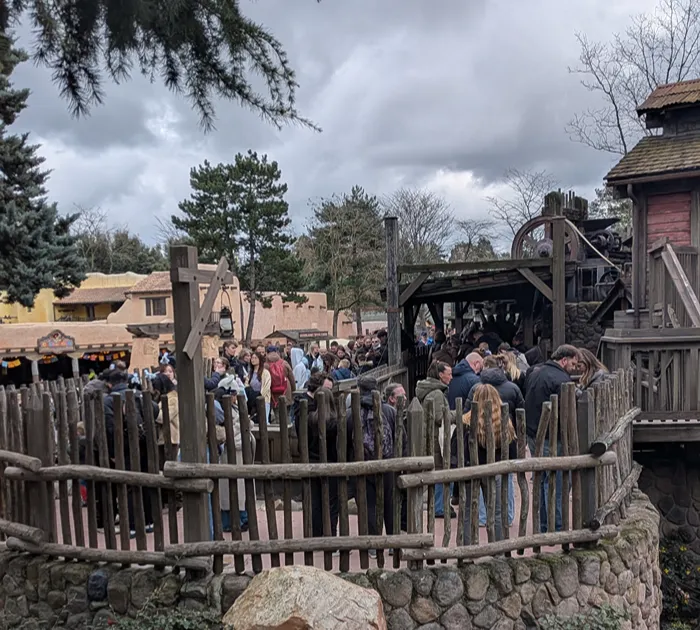
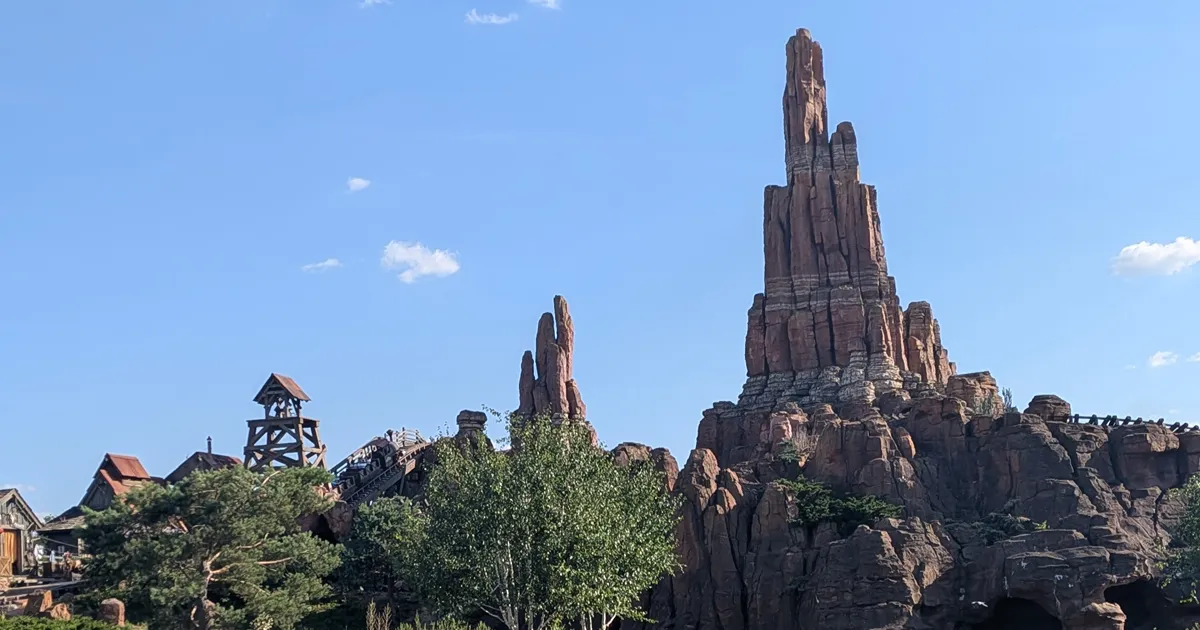
Big Thunder Mountain from Frontierland, the ride that costs the same at almost any hour of the day.
If the park closes early and that window doesn’t exist, then accept the cost with your eyes open: you’re going to pay your 36 extra minutes no matter which hour you pick, so pick it for comfort, temperature, distance, where your food reservation is, and not for a queue theory your own eyes won’t be able to verify.
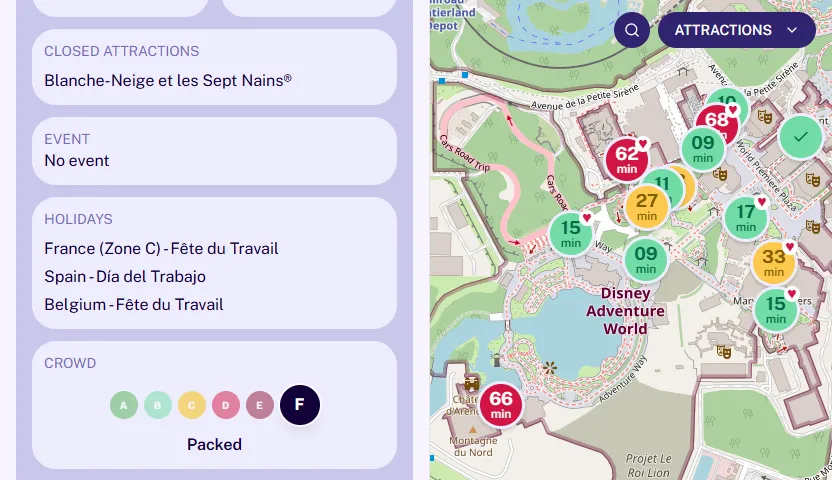
📱 The 36 minutes are a 40-day average. Your specific day isn’t the average. The curve tells you where to place the attraction in the plan; the live data tells you whether today is the day to break the plan. In MagicWait Paris you see Big Thunder’s real wait time right now and the rest of the park’s on the same screen. Access it free!
The side data: ticket price predicts better than color-coded scales
We cross-referenced Big Thunder’s daily wait time with the minimum published ticket price for that day. Correlation: 0.637 over 40 days.
Splitting the window into thirds by price:
| Price tier | Average price | Average wait at Big Thunder | n days |
|---|---|---|---|
| Cheap | €83.80 | 38.2 min | 17 |
| Mid | €89.60 | 43.0 min | 10 |
| Expensive | €101.80 | 48.2 min | 13 |
Cutoff: June 12, 2026.
Ten minutes of difference between the cheap and expensive thirds, and perfectly ordered. That’s not a weak relationship.
The reading is simple, and it’s our hypothesis: Disney knows which days it will fill and says so in the price before you buy. Dynamic pricing wouldn’t just be a commercial policy, but an attendance prediction published months in advance and free for you. If you’re choosing a date and you see a twenty-euro jump between a Tuesday and the following Saturday, that jump is telling you something about the queue you’re going to find.
And it’s not just Big Thunder. In the same 40 days, the price also correlates with the average wait of the whole park (0.563) and with the park median (0.447). In other words: it’s not capturing a quirk of one attraction, it’s capturing the day.
There’s an honest caveat: 40 days is a short window and a correlation isn’t a guarantee. But it’s a free, public indicator available before you book, which is more than most prediction tools can say.
And the day of the week
With the same window, the average daily wait by day of the week:
| Day | Average wait at Big Thunder | n |
|---|---|---|
| Monday | 38.8 min | 6 |
| Tuesday | 41.8 min | 6 |
| Wednesday | 40.0 min | 6 |
| Thursday | 43.5 min | 6 |
| Friday | 46.2 min | 6 |
| Saturday | 47.8 min | 5 |
| Sunday | 40.8 min | 5 |
Cutoff: June 12, 2026.
Nine minutes between Monday and Saturday. It’s real, but it’s less than many people assume, and with five or six days per category it’s worth treating as a trend rather than a law. Sunday, curiously, behaves better than Friday. The ranking of the ones that accumulate the most wait is in the 5 attractions with the longest queues at Disneyland Paris.
A Note from Verónica: the 10pm window is the only safe one
It’s my favorite attraction without a doubt, and I’ve ridden it at many different times and in many different seasons. It can be scary to leave it for the end of the day and have it close for technical issues, but it’s the only moment when we can be sure of waiting relatively little. My advice: use the morning for attractions with short queues and wait until the end of the day to ride it. Sometimes the park rewards you with a 5-minute queue and you can get out and back in (it happened to me once). Either way, the wait is worth it.
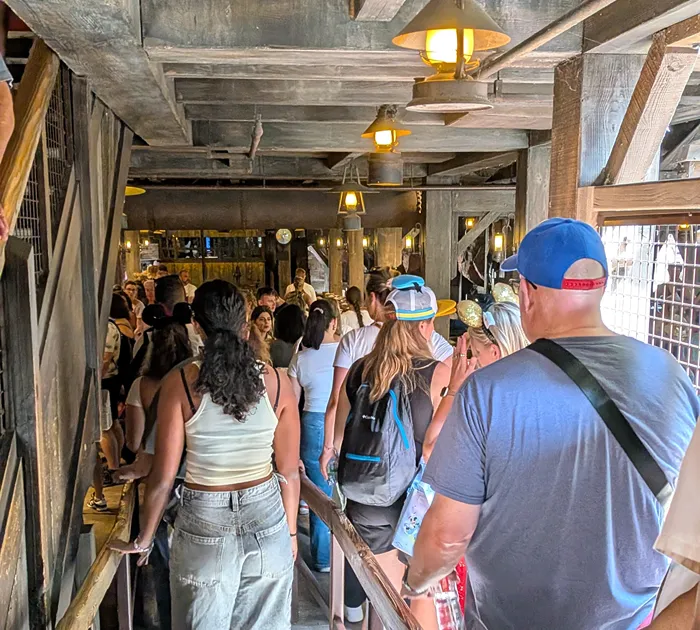
Big Thunder at night, the only window of the day when the wait drops to 18 minutes on average.
Summary
- Big Thunder Mountain’s overcost over the park median is 36.4 minutes and it’s practically constant between 10:00 and 18:00 (deviation 2.1).
- The wait peak is at 12:00 (57 minutes), not mid-afternoon. At 15:00 the curve has already been three hours away from its peak.
- Within regular hours, the only real window of the day is 22:00, with an 18-minute average wait and an overcost of 13.
- At 10:00 the attraction sits at more than eight times the park median: it’s the worst moment of the day to join that queue, even though it’s the most popular.
- In the early-access window for hotel guests, Big Thunder posts 10 minutes at 8:30 versus 42 at 10:00. It’s the biggest hourly difference in the whole dataset.
- Ticket price correlates with wait time (0.637): ten minutes of difference between cheap and expensive days.
The decision you have to make is a single line: if you have early access, Big Thunder first thing; if you don’t, at the end of the day or accepted as a fixed cost. What doesn’t work, in either case, is waiting for it to drop.
Have specific dates and want to know where Big Thunder fits in your day? Write to us at hello@magicwaitparis.com. And for the live data, MagicWait Paris.