We crossed October against the rest of the year across our two complete seasons of history. Of the 26 attractions with a valid series, the median variation is 0%. Attractions in general don’t have longer queues than in any other month of the year, except one. Phantom Manor went from an average of 13.2 minutes to 26 in October 2025: a +97% jump. The second-place finisher in that ranking rose 17%, from a base of five minutes.
And there’s a second number that changes your day plan more than the first: within October, that same attraction averages 36 minutes at 2pm and 9 minutes at 9pm. Four times the queue, on the same day.
Halloween is a very special season and attendance volume is high. Our hypothesis is that this attendance spreads out: there are more character meet-and-greets and parades, which distributes visitors across the day and the park.
The database
| Period | January 1, 2024 to December 31, 2025 |
| Measurements | 2,973,129 |
| October measurements | 117,473 (2024) · 144,886 (2025) |
| Attractions monitored | 37 |
| With a valid series in the cross-check | 26 in 2024 · 26 in 2025 |
| Cut-off | December 31, 2025 |
Three limits of this series, because data without context misleads:
We measure queues, not people. A flat wait doesn’t prove the same number of people: the park can absorb more visitors with extended hours and more operational capacity (like the characters and shows we mentioned). What we measure is the time you spend standing still, which is what shapes your day. It doesn’t mean you won’t run into higher attendance.

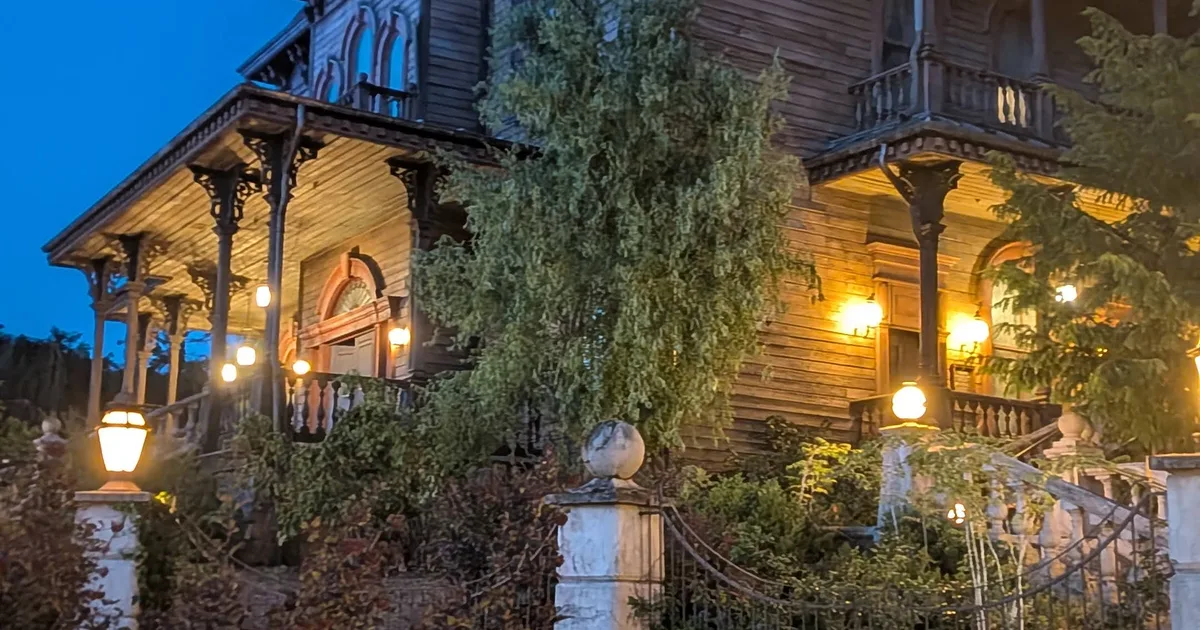
Phantom Manor with its seasonal decor. The same attraction that averages 15 minutes in July averages 26 in October.
Not every attraction is in the series. Our valid series covers 26 of the 37 monitored attractions; the remaining eleven either don’t report a queue or have gaps that invalidate the annual cross-check. “Nothing else moves” should be read as “none of the 26 with a complete series moves”.
October isn’t a busy month
Resort-wide average wait, month by month, 2025:
| Month | Average | Median | n |
|---|---|---|---|
| January | 20 min | 10 | 105,076 |
| February | 20 min | 10 | 99,011 |
| March | 17 min | 10 | 129,935 |
| April | 21 min | 15 | 135,681 |
| May | 18 min | 10 | 143,325 |
| June | 16 min | 10 | 134,778 |
| July | 15 min | 5 | 143,147 |
| August | 15 min | 10 | 146,412 |
| September | 14 min | 5 | 130,448 |
| October | 15 min | 5 | 144,886 |
| November | 13 min | 5 | 134,706 |
| December | 13 min | 5 | 149,160 |
October 2025 was the fourth-fastest month of the year, tied with July and August (all three at a 15-minute average). April, January and February had longer queues than Halloween. In 2024 the result was the same by another route: 17 minutes in October, 17 in the rest of the year. Zero difference. For the month-by-month breakdown of what awaits you on your dates, there’s our guide to Disneyland Paris in October; the full comparison of the two festive seasons is in Halloween and Christmas: crowds and queues.
In 2018 and 2022 the feeling was different: from our visits, park attendance rose significantly in October. We have no series from those years to check it, so I’ll leave it as an impression, not a fact. What our data does measure is that park attendance has increased in recent years regardless of the month, and that October peak no longer appears.
Where the effect does show up
October average versus the average of the other eleven months, same year. The top five of each season:
2025: 26 attractions, median 0%
| Attraction | Park | October | Rest | Δ |
|---|---|---|---|---|
| Phantom Manor | Parc Disneyland | 26 min | 13.2 | +97% |
| Main Street Vehicles | Parc Disneyland | 6 min | 5.1 | +17% |
| Cars ROAD TRIP | Adventure World | 11 min | 9.7 | +13% |
| It’s a small world | Parc Disneyland | 12 min | 10.9 | +10% |
| Casey Jr. | Parc Disneyland | 16 min | 15.3 | +5% |
2024: 26 attractions, median 0%
| Attraction | Park | October | Rest | Δ |
|---|---|---|---|---|
| Phantom Manor | Parc Disneyland | 17 min | 10.1 | +68% |
| Mickey’s PhilharMagic | Parc Disneyland | 11 min | 9.9 | +11% |
| Disneyland Railroad Frontierland | Parc Disneyland | 21 min | 19.1 | +10% |
| Le Pays des Contes de Fées | Parc Disneyland | 7 min | 6.5 | +8% |
| Avengers Assemble: Flight Force | Adventure World | 15 min | 14.3 | +5% |
Two independent seasons, same result: Phantom Manor multiplies the runner-up’s effect by six (2024) and by almost six (2025). Everything else moves within the normal noise of any given month.
And at the other end of the 2025 table sits the number that surprised us most when we calculated it: Crush’s Coaster dropped 5% in October (64 min vs. 67.5) and Tower of Terror dropped 2% (30 vs. 30.6). The two attractions anyone would name as Halloween-effect candidates don’t even notice it’s October.
Phantom Manor vs. Tower of Terror
The resort’s two “scary” attractions, compared over the same 37 days of 2025 in which both series have complete data:
| Phantom Manor | Tower of Terror | |
|---|---|---|
| Park | Parc Disneyland | Adventure World |
| Average | 25 min | 29 min |
| p90 | 40 min | 50 min |
| Peak maximum | 75 min | 155 min |
n = 37 days with data in each series, 2025. These averages are not the full-year ones: the window is mostly October, the only month in which Phantom Manor moves away from its average (26 min in October vs. 13-15 the rest of the year).
The seasonal effect of each one is what opens the article: +97% for Phantom Manor and −2% for Tower of Terror, October versus the rest of the year, according to the table in the “Where the effect does show up” section. They are two different metrics: Tower of Terror wins in absolute queue and loses by a landslide in seasonal effect.
In absolute terms, Tower of Terror is the worse queue of the two: higher average, higher p90 and more than double the peak. But it’s a stable queue all year round. Phantom Manor is a small queue that becomes something else in October.
Our hypothesis is that the effect isn’t thematic, it’s geographic: the festival happens in Parc Disneyland, and demand concentrates on the only attraction in that park that was already Halloween 365 days a year. It doesn’t cross over to the neighboring park, and that part we do measure: Tower of Terror is a ten-minute walk away and doesn’t register a single extra minute.
If your October plan includes Adventure World, don’t reshuffle it for the season: Tower of Terror, Crush’s Coaster and Flight Force behave exactly as in any other month.
The exact shape of the peak
Phantom Manor month by month, both seasons:
| Month | 2024 | 2025 | p90 2025 | Max 2025 | n 2025 |
|---|---|---|---|---|---|
| July | 7 min | 15 min | 30 | 60 | 4,801 |
| August | 11 min | 15 min | 30 | 50 | 4,660 |
| September | 10 min | 13 min | 25 | 45 | 4,108 |
| October | 17 min | 26 min | 40 | 75 | 4,478 |
| November | 15 min | 15 min | 35 | 70 | 2,753 |
| December | 11 min | 14 min | 30 | 60 | 4,743 |
It doubles and then halves again within thirty days. The p90 column tells the rest: in 10% of October measurements the queue sat above 40 minutes, with a real recorded maximum of 75. For an attraction whose usual queue is 13 minutes, in October you’re not riding the same attraction.
The jump from 2024 to 2025 (+68% to +97%) also points to the effect growing. We can’t predict the exact 2026 number, but we can say the direction has been the same for two years.
The hour matters five times more than the day
Phantom Manor’s hourly curve in October 2025:
| Time | Average | Recorded peak |
|---|---|---|
| 8am | 3 min | 5 |
| 9am | 6 min | 15 |
| 10am | 14 min | 50 |
| 11am | 24 min | 50 |
| 12pm | 30 min | 60 |
| 1pm | 34 min | 70 |
| 2pm | 36 min | 75 |
| 3pm | 33 min | 65 |
| 4pm | 35 min | 60 |
| 5pm | 31 min | 70 |
| 6pm | 30 min | 60 |
| 7pm | 22 min | 45 |
| 8pm | 15 min | 60 |
| 9pm | 9 min | 45 |
| 10pm | 9 min | 35 |
| 11pm | 5 min | 5 |
n = 4,478 measurements, October 2025.
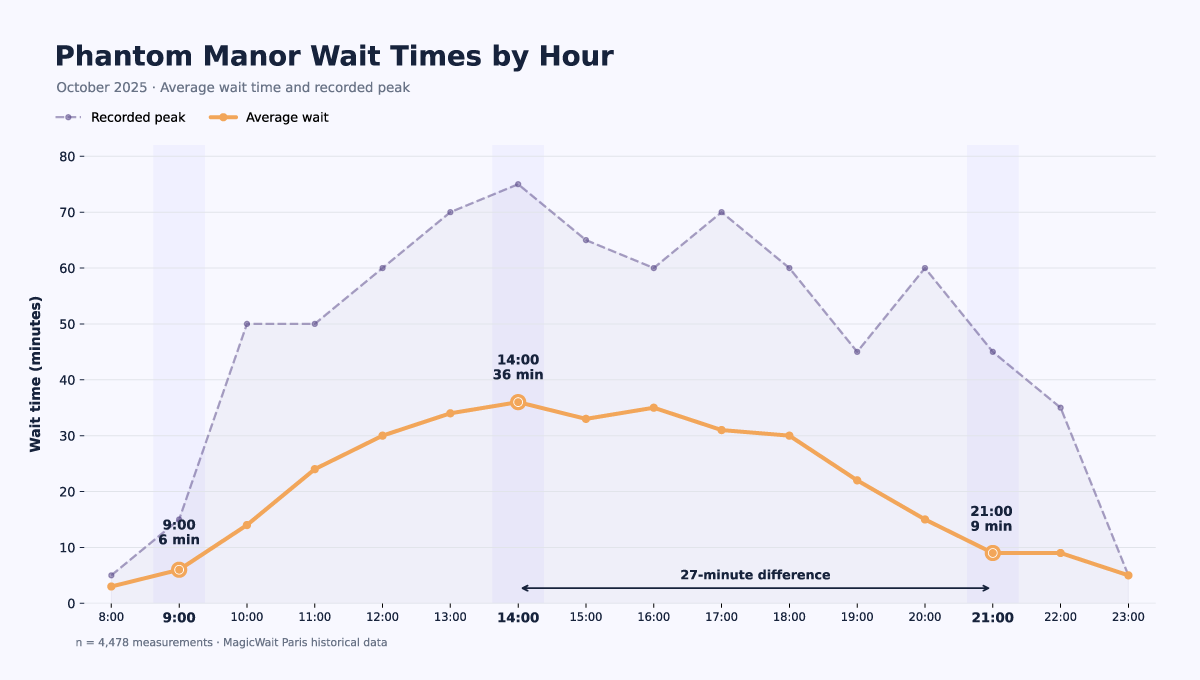
Phantom Manor’s average wait per hour in October 2025: it rises from 9am, stays above 30 minutes between 12pm and 6pm, and falls to 9 minutes at 9pm.
27 minutes of difference between 2pm and 9pm.
Now compare that with the difference from picking the right day. Taking the twenty peak days of October 2025, the weekend average was 32.3 minutes and the weekday average 27.3: five minutes.
Choosing the right hour saves you more than five times what choosing the right weekday saves you. And choosing the hour is free and doesn’t depend on your work calendar. The detail of how each attraction’s hourly capacity is distributed explains why the hour weighs so much.
📱 The limit of the table above is that it’s an average, not your day. If on October 17 at 7pm the queue has already dropped to 12 minutes, waiting until 9pm is overkill. On MagicWait Paris you have live times and the history of the two previous seasons filtered by your exact dates. Get free access!
The first fortnight isn’t quieter (for this attraction)
The days with the highest average waits for Phantom Manor in October 2025 weren’t at the end of the month:
| Date | Day | Average | Peak |
|---|---|---|---|
| October 11 | Saturday | 37 min | 70 |
| October 4 | Saturday | 35 min | 65 |
| October 30 | Thursday | 35 min | 60 |
| October 31 | Friday | 33 min | 60 |
| November 1 | Saturday | 33 min | 55 |
| October 25 | Saturday | 32 min | 65 |
Taken from the month’s 20 peak days, with 122 to 162 measurements per day. These twenty days are not the whole month: they serve to locate the maximums, not to calculate the monthly average, which is the 26-minute one from the previous table.
The first two Saturdays of October beat the 31st. Our hypothesis is that each peak has a different engine: general park attendance at the end of the month is pushed by the French school holidays, while Phantom Manor’s peak is generated by people going specifically to see the haunted attraction during its month, and those people arrive on the first available weekend, not the last.
For this attraction specifically, the season starts at full throttle from day one.
A Note from Verónica: the two good windows are equivalent
Notice that the two good windows are equivalent: 6 minutes at 9am and 9 at 9pm. The difference is in what surrounds each one: in the morning you arrive with the whole day ahead of you, and at night you have the seasonal atmosphere and, if it coincides, the window that opens the nighttime show, which is when the queue really drops. That’s why we recommend going at the end of the day: it’s an attraction with a lot of nighttime appeal, and waiting nine minutes with a half-empty park isn’t the same as waiting them in the middle of the afternoon.
The decision
Two seasons of data boil down to a single decision you need to make before you cross the turnstile: what time you’ll ride Phantom Manor.
- Before 11am. Averages of 6 minutes at 9am and 14 at 10am. If you open your day in Frontierland, you ride it practically walking on.
- From 8pm on. At 9pm the average drops to 9 minutes, with the seasonal atmosphere and a half-empty park.
- Between 12pm and 6pm, no. Seven straight hours above 30 minutes on average, with recorded peaks up to 75. It’s the only stretch of the only spot in the park where Halloween charges you a toll.
Plan the rest of the day like you’d plan any other day of the year. The median for the other 25 attractions is 0%: there’s nothing else to reshuffle. That’s the counterintuitive part, and it’s the part that gives you hours back. For the full day framework, our guide to saving two hours of queues with data.
A calendar note for 2026: the festival runs from September 26 to November 1, and it’s the first time it starts before October 1, so our October monthly series doesn’t cover the five September days that are already season this year. The effect probably starts earlier than the curve suggests. We’ll measure it.
If you already have your dates locked in and want to see how those exact days behaved in the two previous seasons, the full history is on MagicWait Paris. And if your case falls outside the average, a group with reduced mobility, a single day with small children, arriving at midday, write to us at hello@magicwaitparis.com and we’ll look at it with your specific dates.