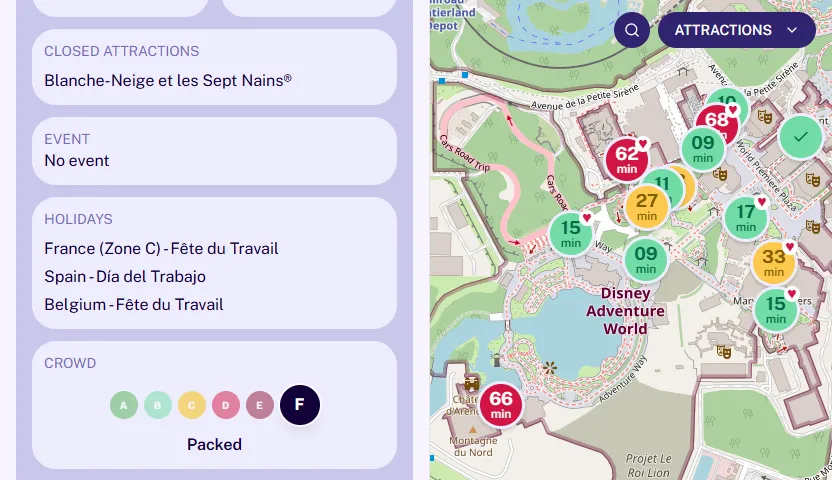

The most surprising figure when you cross two years of wait times at Disneyland Paris is not how much the queue grows in high season. It’s how little it grows compared with the difference between being in one park or the other. Between January 2024 and September 2026 we have recorded 23,865 wait-time snapshots across the attractions of both parks. On that base, the six busiest months of the year average a 19-minute wait; the six quietest, 15. Four minutes of difference. In contrast, the average wait at Disney Adventure World almost doubles that of Parc Disneyland, and the gap between the two parks has grown, not shrunk, from 2024 to 2025.
This article covers how real crowds move: by season, by park, by day of the week, by attraction and, with day-by-day detail, month by month.
High season vs. low season: the difference is smaller than it looks
| Crowd level | Median wait | Average wait | P90 | Months | Days analyzed |
|---|---|---|---|---|---|
| Higher crowds | 10 min | 19 min | 50 min | 6 | 181 |
| Lower crowds | 5 min | 15 min | 40 min | 6 | 183 |
MagicWait Paris data, 2024-2025 aggregate, n = 364 days.
The median goes from 5 to 10 minutes and the average rises 4 minutes. Even at the 90th percentile, the level that marks a genuinely packed day, the difference is only 10 minutes (40 vs. 50).
A note from Verónica: when we launched MagicWait, my first assumption was that the season calendar would explain almost everything. Looking month by month for two straight years, what I’ve had to correct in my head the most is not the gap between seasons: it’s accepting that the park you’re in weighs far more than the month you go.
What you do need to keep in mind is that a lower-crowd day, even when queues don’t vary much, does change the experience. You’ll notice it in the walkways, which will be more comfortable, at mealtimes, and watching the shows and characters.
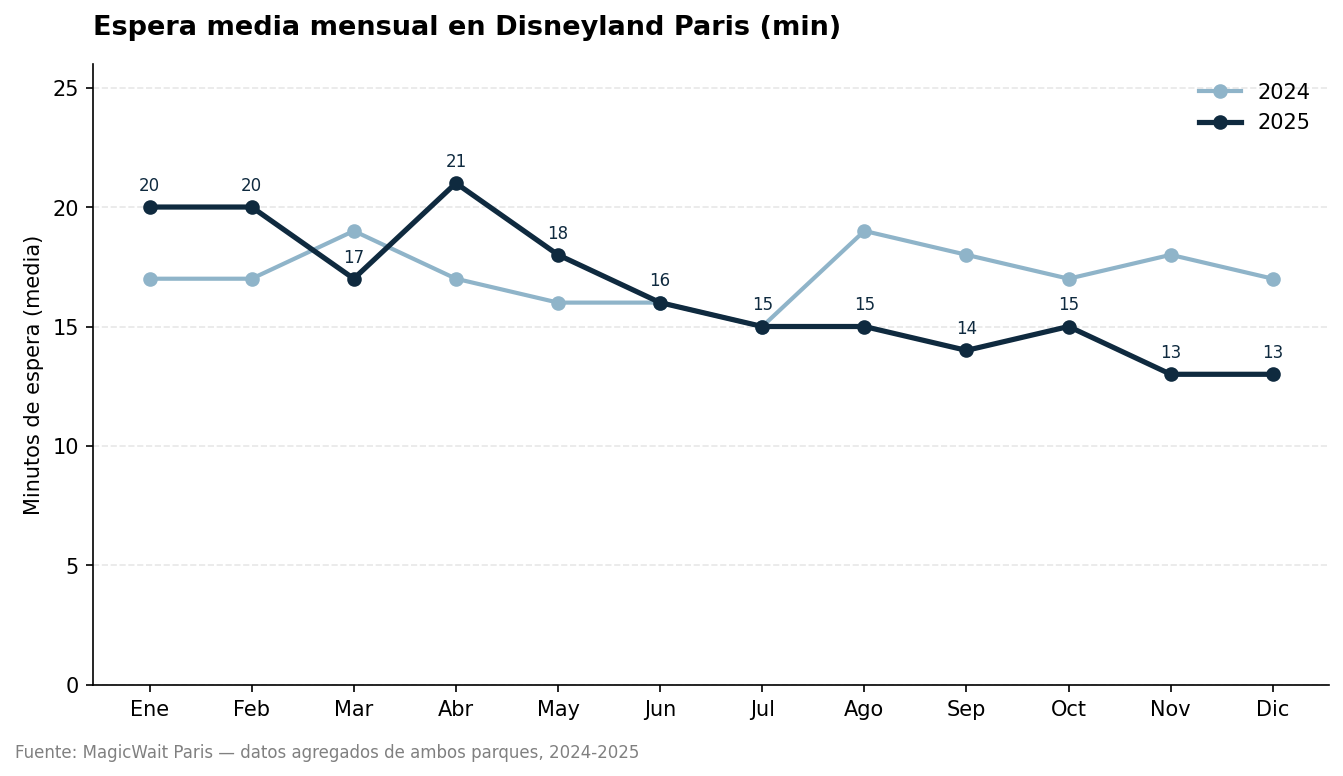
MagicWait Paris data, monthly average wait in minutes, both parks combined.
At monthly level, the month with the highest average of the period was April 2025 (21 min), coinciding with Easter and the May bank holidays. The quietest months were November and December 2025, both averaging 13 minutes. The same month can behave very differently from one year to the next: August 2024 averaged 19 minutes, while August 2025 dropped to 15. The 2024 line and the 2025 line cross in March and cross again in August, with no fixed pattern repeating month to month. The calendar points you in the right direction, but it doesn’t replace the data for the specific year.
The gap that actually matters: Parc Disneyland vs. Disney Adventure World
| Park | Year | Median | Average | Snapshots (n) |
|---|---|---|---|---|
| Parc Disneyland | 2024 | 5 min | 14 min | 990,059 |
| Parc Disneyland | 2025 | 5 min | 13 min | 1,159,670 |
| Disney Adventure World | 2024 | 15 min | 24 min | 386,505 |
| Disney Adventure World | 2025 | 20 min | 26 min | 436,895 |
MagicWait Paris data, full annual base 2024 and 2025.
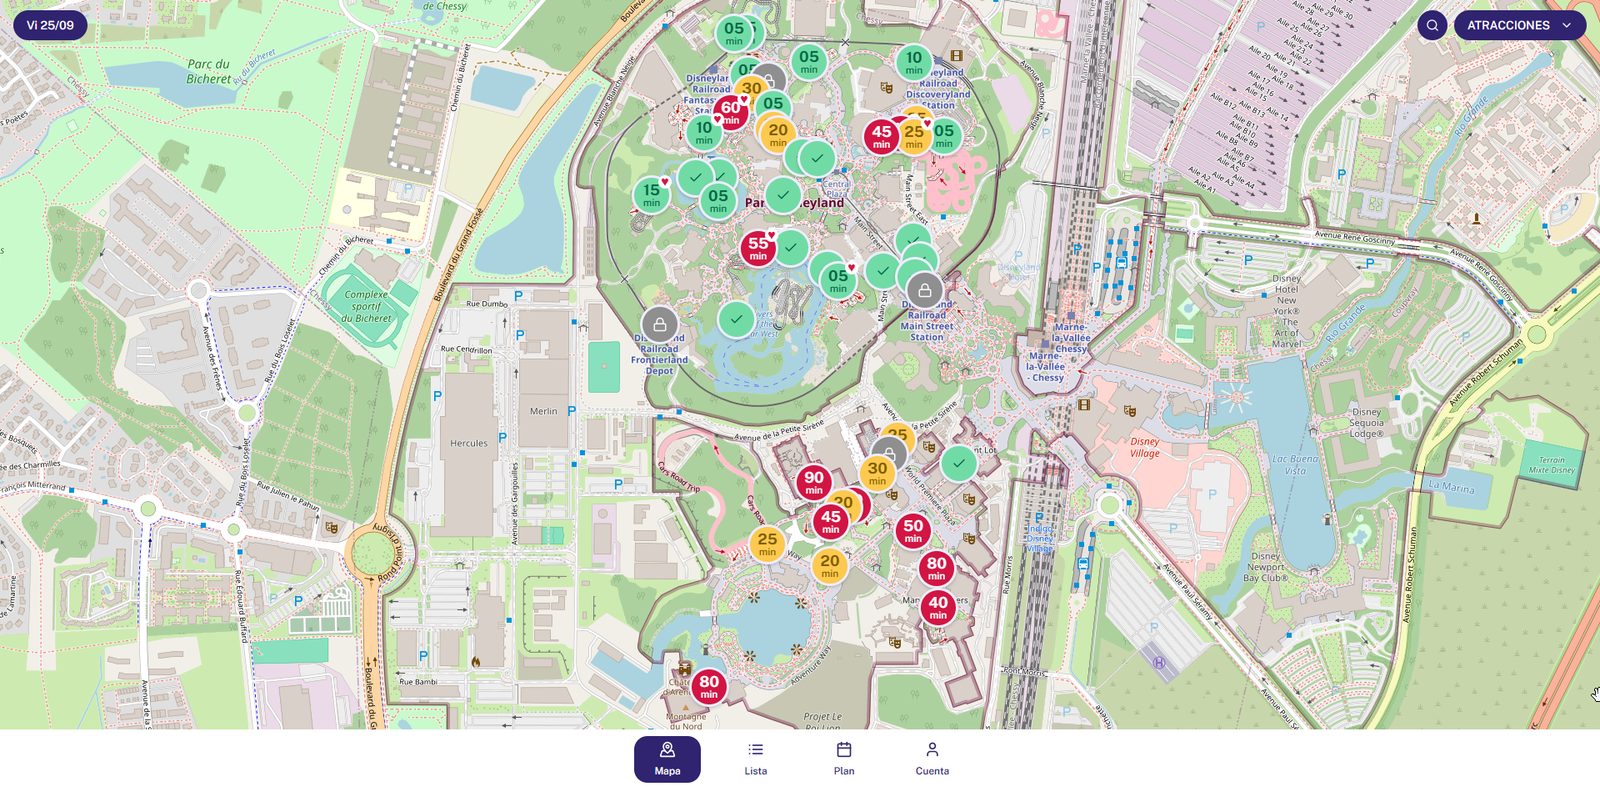
As you can see, on any given day at any given hour, visitor load at Disney Adventure World is much higher than at the other park. All attractions are red or yellow, with waits above an hour.
The median wait at Parc Disneyland stays stable and low: 5 minutes both years. At the second park, the median rose from 15 to 20 minutes year over year, a 33% jump, while the average grows from 24 to 26 minutes. With fewer attractions spreading the same volume of visitors, any change in crowds is felt far more there than at Parc Disneyland. And although 2026 isn’t over, we can predict that this increase has kept growing with the opening of the new Adventure Way area inside the park.
Halloween, Christmas and Easter: not all events behave the same
| Period | Average | Median | P90 | Days |
|---|---|---|---|---|
| Halloween 2024 | 17 min | 10 min | 45 min | 37 |
| Halloween 2025 | 15 min | 5 min | 40 min | 37 |
| Christmas 2024/25 | 18 min | 10 min | 45 min | 9 |
| Christmas 2025/26 | 14 min | 5 min | 40 min | 9 |
| Easter 2024 | 23 min | 15 min | 55 min | 8 |
| Easter 2025 | 23 min | 15 min | 55 min | 8 |
We already analyzed Halloween in detail in Halloween effect: 2.9 million and queues at Disneyland Paris; here we place it alongside the other two big events on the calendar.
Halloween and Christmas dropped year over year across all three reliable metrics. Easter, on the other hand, hasn’t moved a single minute between 2024 and 2025 in average, median or P90. Of the three big events on the calendar, it’s the only one that behaves identically year after year, the most predictable stretch, and also the busiest of the three.
Which attractions feel the season most (and which don’t feel it at all)
| Attraction | Park | Median high months | Median low months | Difference |
|---|---|---|---|---|
| Meet Mickey Mouse | Parc Disneyland | 60 min | 30 min | 30 min |
| Welcome to Starport: A Star Wars Encounter | Parc Disneyland | 30 min | 13 min | 17 min |
| The Twilight Zone Tower of Terror | Disney Adventure World | 35 min | 26 min | 9 min |
| Crush’s Coaster | Disney Adventure World | 72 min | 63 min | 8 min |
| Avengers Assemble: Flight Force | Disney Adventure World | 17 min | 13 min | 4 min |
MagicWait Paris data, comparison of the 6 highest-crowd months vs. the 6 lowest-crowd months, n=6 months per group.
Meet Mickey Mouse is, by far, the attraction that feels the season most: it doubles its wait between quiet months and busy months. That makes sense: a meet & greet can only process families at a fixed rate per hour, so any excess demand translates directly into queue, with no operational margin to absorb it.
At the other extreme, several attractions show a 0-minute difference between high and low season: scenic rides or very high-capacity ones like Adventure Isle, La Tanière du Dragon or Pirates’ Beach, where the format itself is a free walkthrough, with no structural queue, so the park’s overall crowds barely show up in that specific attraction’s wait time.
A note from Verónica: this is what I repeat most to the families who write to us asking for itinerary advice: don’t ask “is it high season?”, ask “what kind of attraction is it?” and “what matters most to you?”. A meet & greet in August and one in November can differ by double; a scenic walkthrough, not at all.
The day of the week matters less than the myth
| Day | Median | Average |
|---|---|---|
| Monday | 5 min | 15 min |
| Tuesday | 5 min | 14 min |
| Wednesday | 5 min | 14 min |
| Thursday | 5 min | 13 min |
| Friday | 5 min | 15 min |
| Saturday | 10 min | 18 min |
| Sunday | 5 min | 16 min |
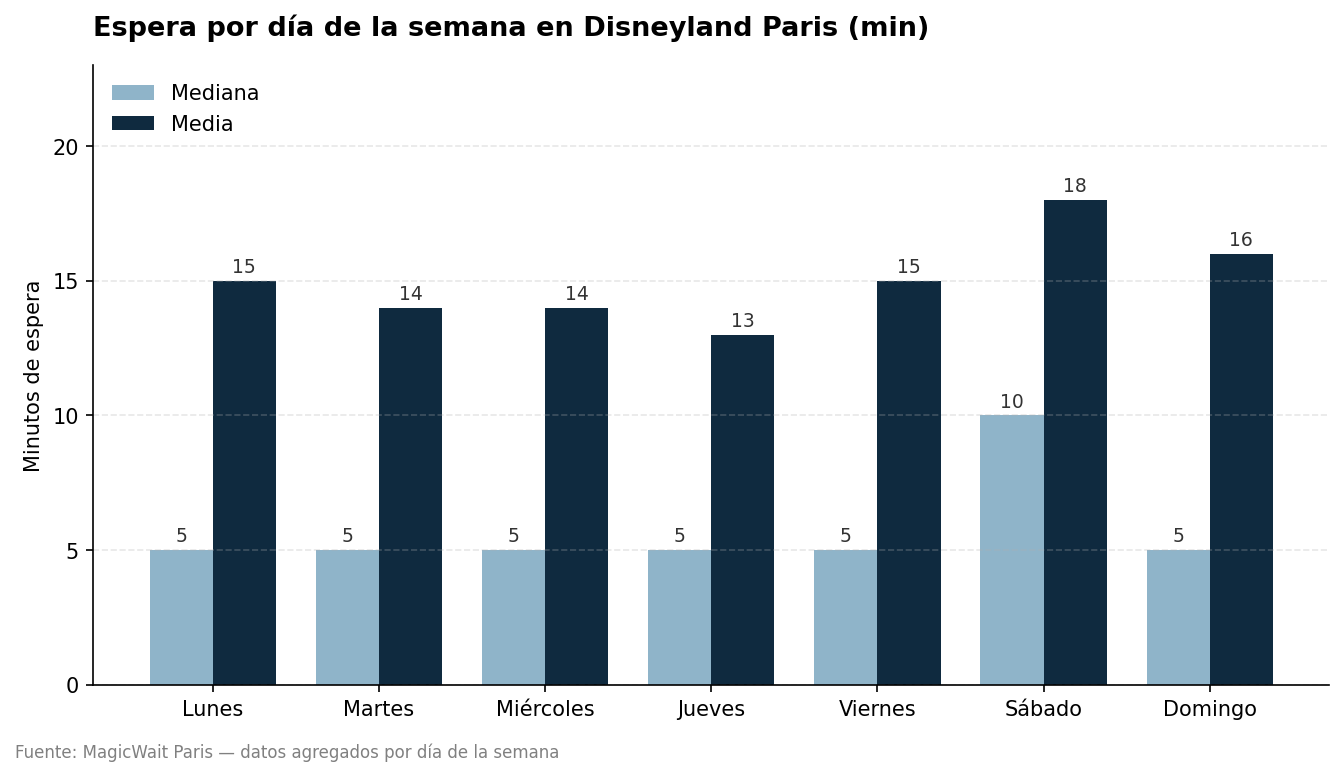
MagicWait Paris data, aggregated by day of the week.
Saturday is the only day that clearly stands out from the rest, with a median that doubles a Thursday’s. The rest of the week moves within a very narrow range (13-16 minutes on average). If your goal is to avoid queues by weekly calendar, the real decision isn’t “avoid the weekend”: it’s “avoid Saturday specifically”, because Sunday behaves almost like a weekday.
The best and worst day of each month, month by month (2024-2025)
| Month | Best day | Median | Worst day | Median |
|---|---|---|---|---|
| Jan 2024 | 2024-01-23 (Tue) | 5 min | 2024-01-19 (Fri) | 15 min |
| Feb 2024 | 2024-02-01 (Thu) | 5 min | 2024-02-20 (Tue) | 15 min |
| Mar 2024 | 2024-03-11 (Mon) | 5 min | 2024-03-07 (Thu) | 15 min |
| Apr 2024 | 2024-04-21 (Sun) | 5 min | 2024-04-03 (Wed) | 15 min |
| May 2024 | 2024-05-02 (Thu) | 5 min | 2024-05-07 (Tue) | 15 min |
| Jun 2024 | 2024-06-05 (Wed) | 5 min | 2024-06-10 (Mon) | 10 min |
| Jul 2024 | 2024-07-24 (Wed) | 5 min | 2024-07-01 (Mon) | 10 min |
| Aug 2024 | 2024-08-03 (Sat) | 5 min | 2024-08-13 (Tue) | 15 min |
| Sep 2024 | 2024-09-07 (Sat) | 5 min | 2024-09-27 (Fri) | 15 min |
| Oct 2024 | 2024-10-30 (Wed) | 5 min | 2024-10-28 (Mon) | 15 min |
| Nov 2024 | 2024-11-06 (Wed) | 5 min | 2024-11-01 (Fri) | 15 min |
| Dec 2024 | 2024-12-31 (Tue) | 5 min | 2024-12-27 (Fri) | 10 min |
| Jan 2025 | 2025-01-21 (Tue) | 5 min | 2025-01-06 (Mon) | 15 min |
| Feb 2025 | 2025-02-25 (Tue) | 5 min | 2025-02-20 (Thu) | 15 min |
| Mar 2025 | 2025-03-10 (Mon) | 5 min | 2025-03-29 (Sat) | 15 min |
| Apr 2025 | 2025-04-03 (Thu) | 10 min | 2025-04-22 (Tue) | 20 min |
| May 2025 | 2025-05-12 (Mon) | 5 min | 2025-05-02 (Fri) | 15 min |
| Jun 2025 | 2025-06-03 (Tue) | 5 min | 2025-06-08 (Sun) | 15 min |
| Jul 2025 | 2025-07-28 (Mon) | 5 min | 2025-07-31 (Thu) | 10 min |
| Aug 2025 | 2025-08-03 (Sun) | 5 min | 2025-08-20 (Wed) | 10 min |
| Sep 2025 | 2025-09-30 (Tue) | 5 min | 2025-09-09 (Tue) | 10 min |
| Oct 2025 | 2025-10-09 (Thu) | 5 min | 2025-10-30 (Thu) | 15 min |
| Nov 2025 | 2025-11-18 (Tue) | 5 min | 2025-11-15 (Sat) | 10 min |
| Dec 2025 | 2025-12-04 (Thu) | 5 min | 2025-12-13 (Sat) | 10 min |
MagicWait Paris data, best and worst day by median wait, one month selected from each of the 24 months of the 2024-2025 period (n=24 months).
Two patterns repeat across these 24 months. First, the best day of the month almost always has a 5-minute median, broken only once, in April 2025 (10 min), the busiest month of the period. Second, and more useful for planning: Friday never appears as the best day of any month in two years of data, and it does appear five times as the worst day, almost as often as Tuesday. Tuesday, in contrast, is both the day that is most often “the best of the month” (7 of 24) and one of the most often “the worst” (5 of 24); it’s not a reliable day in either direction, it varies month to month. If you’re looking for the day most likely to be good within any given month, the data points more to Monday or Thursday than to Friday.
Which attractions gain the most from a quiet month: the case of November 2025
| Attraction | Park | Median Nov 2025 | Annual median | Month/year ratio |
|---|---|---|---|---|
| Star Tours: The Adventures Continue | Parc Disneyland | 5 min | 10 min | 0.50 |
| Les Tapis Volants - Flying Carpets Over Agrabah | Disney Adventure World | 5 min | 10 min | 0.50 |
| Cars Quatre Roues Rallye | Disney Adventure World | 5 min | 10 min | 0.50 |
| Slinky Dog Zigzag Spin | Disney Adventure World | 5 min | 10 min | 0.50 |
| Phantom Manor | Parc Disneyland | 5 min | 10 min | 0.50 |
| Disneyland Railroad Main Street Station | Parc Disneyland | 20 min | 30 min | 0.67 |
| Casey Jr. – le Petit Train du Cirque | Parc Disneyland | 10 min | 15 min | 0.67 |
| Avengers Assemble: Flight Force | Disney Adventure World | 10 min | 15 min | 0.67 |
| Disneyland Railroad Frontierland Depot | Parc Disneyland | 20 min | 30 min | 0.67 |
| RC Racer | Disney Adventure World | 25 min | 35 min | 0.71 |
MagicWait Paris data, November 2025 vs. each attraction’s annual median (ratio = month median / annual median; lower ratio = an especially quiet month for that attraction). Single reference month (n=1 month).
The ratio measures how much a specific attraction’s queue shrinks in a quiet month, compared with its own year, not with the rest of the park. Five attractions drop to half their usual wait (ratio 0.50): a long dark ride like Star Tours, a short train like Slinky Dog Zigzag Spin and a low-capacity haunted house like Phantom Manor among them. The Disneyland Railroad trains, on the other hand, only drop to 67% of their annual median; their queue depends less on the park’s overall volume and more on the train’s own frequency, so a quiet month relieves them less than a high-demand attraction like Star Tours.
A note from Verónica: this is the table I use most myself when someone asks me “is November worth it?”. The short answer is yes, but not uniformly: some attractions barely queue in November, and others (especially the trains and the ones already capacity-limited) barely notice it. A ranking like this only makes sense with your own per-attraction data, month by month.
What to do with this
Four concrete decisions come straight out of the data:
- Choose your park by the hour, not just by the day. The gap between Parc Disneyland and Disney Adventure World is bigger than the gap between high and low season, and it grew in 2025.
- At Easter, don’t expect a better year than the last. It’s the only one of the three big events that has stayed exactly the same two years running; plan as if it were the busiest day on the calendar, because statistically it is.
- If the plan includes a meet & greet, book it as soon as the park opens. It’s the type of experience where the season shows most; the rest of the itinerary has more margin than most guides suggest.
- If you can choose your day within the month, avoid Friday and try Monday or Thursday. In two years of data, Friday has never been the best day of any month.
With 23,865 records spread across 2024 and 2026, this is what the data says today: not a forecast, but what has already happened. With MagicWait Paris you can see these same patterns applied to the specific day of your visit, with 90-day predictions based on this same history.
The video that sums it up
We’ve summarized this analysis in a short video:
If you’re planning a visit and want us to review your specific case, family, travel agency or already-booked dates, write to us at hello@magicwaitparis.com.