
In the 2025/26 Christmas season, the stretch with the most queuing in the whole period was 2 to 6 January: a 17-minute average wait and a p90 of 40 minutes. 24 and 25 December, by contrast, were the quietest days of the whole season: an 11-minute average and a p90 of 30. New Year’s Eve and New Year’s Day were not the peak either.
This is not an impression, and it is not a reading of the school calendar. It is 501,558 wait-time readings taken by MagicWait Paris across the last two Christmas seasons (222,488 in 2024/25 and 279,070 in 2025/26), cross-referenced with the 2.47 million readings from the rest of those two years.
This article is written for one specific situation: the family (or group of friends) that cannot choose its dates. The ones who travel from 26 December to 6 January because that is the holiday they have, and for whom the universal advice “go on a Tuesday in November” is no use at all. If that is you, what you are deciding is not when you go, but what you do on each of the days you have already booked. And that is where the data changes the plan.
The Christmas season, stretch by stretch
This is the table nobody publishes: the season split into six windows, with the last two editions head to head.
| Window | 24/25 average | 24/25 median | 24/25 p90 | 25/26 average | 25/26 median | 25/26 p90 |
|---|---|---|---|---|---|---|
| Decorated low season | 17 min | 5 | 45 | 12 min | 5 | 35 |
| The week before | 16 min | 5 | 40 | 14 min | 5 | 35 |
| Christmas Eve and Christmas (24-25 Dec) | 17 min | 10 | 40 | 11 min | 5 | 30 |
| The “official” peak (26 Dec-1 Jan) | 18 min | 10 | 45 | 15 min | 5 | 40 |
| Epiphany (Jan 2-6) | 24 min | 15 | 60 | 17 min | 10 | 40 |
| Post-Epiphany drop (7-15 Jan) | 20 min | 10 | 55 | 14 min | 5 | 35 |
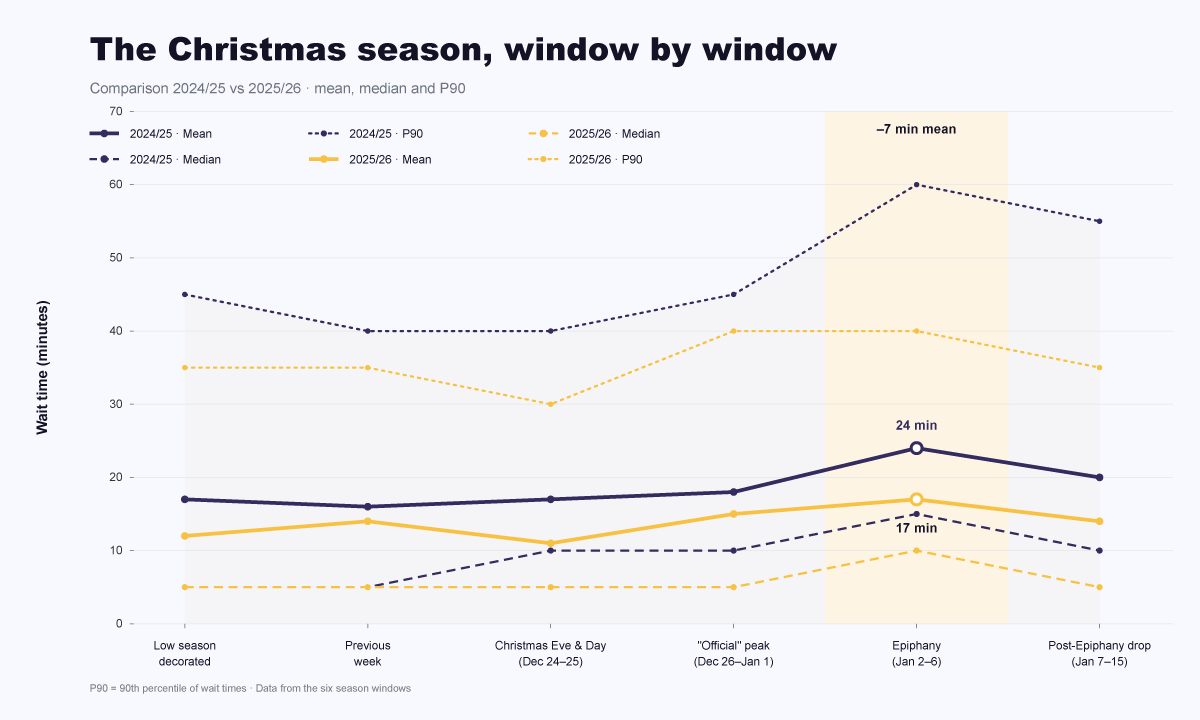
The Christmas season, window by window: 2024/25 versus 2025/26 with average, median and p90. The average rises to 24 minutes at Epiphany in 2024/25 and to 17 in 2025/26.
What p90 is, and why you will see it in every table. Sort all the readings for a period from lowest to highest and stop at the point where you have left 90% behind: that value is the p90. In the 2025/26 Christmas season the median was 5 minutes and the p90 was 35. In plain terms: the typical moment was a 5-minute queue, but in the worst 10% you were looking at 35 minutes or more.
The three numbers tell different stories, which is why they go together. The median describes the ordinary moment. The average is useful for comparing one period with another. And the p90 describes the bad hours, the ones you actually remember when you get home saying you never stopped queuing.
The pattern repeats in both seasons, and it is the same one: the Epiphany window is the ceiling of Christmas, ahead of the week between Christmas and New Year, the one everybody points to. In 2024/25 the gap was brutal: a 24-minute average against 18, and a p90 of 60 against 45. That is, one in ten readings on those days was an hour of queuing or more.
And look at what the p90 does with the key comparison in the table. Between the Epiphany window and the Christmas Eve window of 2025/26 there is a 6-minute difference in the average, 17 against 11, which does not sound like much. In the p90 the difference is 10 minutes: 40 against 30. What sets the bad stretches apart is not the ordinary day so much as how bad they get when they do turn bad.
There is one more detail pointing in the same direction. In 2025/26 the absolute peaks collapsed across the whole season: the ceiling of nearly every window stayed between 90 and 120 minutes.
Why this happens. On 24 and 25 December many people are having dinner at home, travelling, or simply not in a park. From 2 January everything piles up: school holidays are still running across half of Europe, Spain goes all in on its Epiphany week, and anyone who spent New Year’s Eve in Paris finishes the trip in the park. The week between Christmas and New Year has a hellish reputation, but the data says hell arrives a week later.
Christmas is not the season with the longest queues
This is where the consensus falls apart completely. The general belief, repeated in guides, forums and crowd calendars, is that Christmas is one of the crowd peaks of the year at Disneyland Paris. It is not.
| Period | Average | Median | p90 | n (readings) |
|---|---|---|---|---|
| Easter week 2024 | 23 min | 15 | 55 | 27,786 |
| Easter week 2025 | 23 min | 15 | 55 | 35,686 |
| 1 May long weekend 2025 | 20 min | 10 | 50 | 23,164 |
| August 2024 | 19 min | 10 | 45 | 120,760 |
| Christmas season 2024/25 | 18 min | 10 | 45 | 222,488 |
| 8 May long weekend 2025 | 17 min | 10 | 45 | 23,268 |
| Rest of 2025 (excluding Christmas) | 17 min | 10 | 45 | 1,320,367 |
| Halloween 2025 | 15 min | 5 | 40 | 171,269 |
| August 2025 | 15 min | 10 | 40 | 146,412 |
| Christmas season 2025/26 | 13 min | 5 | 35 | 279,070 |
One thing to keep in mind: this is the coldest season of the year, so time outdoors shrinks, there are fewer outdoor shows and characters, and the park closes earlier. As we said about Halloween, that can give the feeling that the park is more saturated than at other times of the year.
Easter week is the real peak of the year, and it is, with remarkable consistency: average 23, median 15 and p90 55 in 2024, and exactly the same three numbers in 2025. Christmas 2025/26, by contrast, was gentler than any ordinary day in the rest of the year (13 against 17 on the average) and gentler than August.
Another way to see it: among the most crowded days recorded in each year, only 2 in 2024 and 3 in 2025 fell inside the Christmas season. The rest are “normal” days from other periods.
What changed between one Christmas and the next
The year-on-year drop is big: from 18 to 13 minutes on the average (-28%), from 10 to 5 on the median and from 45 to 35 on the p90. Before drawing conclusions, the obvious has to be ruled out: did Christmas drop, or did everything drop?
Not everything dropped. The rest of the year stayed identical across the two seasons: average 17, median 10 and p90 45 in 2024 and in 2025, with more than 1.1 and 1.3 million readings respectively. If the drop were an artefact (more attractions monitored, more opening hours recorded, a change in data collection), it would have taken the annual average with it. It did not. The decompression is specific to Christmas.
What I cannot tell you is why. It could be crowd redistribution, operating capacity, extended opening hours, or a combination. Disney does not publish daily attendance figures, so any causal explanation would be fabricated. The data is solid; the cause, we do not have.
Saturday is no longer worse than Tuesday
This is the finding that breaks the most plans, because it contradicts the most repeated advice in every guide.
| Year | Window | Saturday median | Tuesday median | Difference |
|---|---|---|---|---|
| 2024 | November | 10 min | 5 min | +5 |
| 2024 | Christmas peak | 10 min | 5 min | +5 |
| 2025 | November | 5 min | 5 min | 0 |
| 2025 | Christmas peak | 5 min | 5 min | 0 |
In 2024, choosing Tuesday instead of Saturday halved the median. In 2025 that advantage vanished in both windows measured. Be careful how you read it: these are low medians, where a 5-minute difference is a lot in percentage terms and little in the real queue. But the direction is unmistakable, and it means that in the Christmas season you no longer buy anything by moving your big day from Saturday to Tuesday. If you were sacrificing your weekend for that reason, the sacrifice no longer pays off.
Where the crowds build up: one park fills, the other decompresses
The overall average hides the most useful part. When you look attraction by attraction, comparing the Christmas median with the annual median of that same attraction, a very clean pattern appears.
| Attraction | Park | Christmas median | Annual median | Ratio | % of days >60 min |
|---|---|---|---|---|---|
| It’s a small world | Disneyland Park | 10 min | 5 | 2.00 | 0% |
| Peter Pan’s Flight | Disneyland Park | 55 min | 50 | 1.10 | 23% |
| Pirates of the Caribbean | Disneyland Park | 17 min | 15 | 1.10 | 0% |
| Phantom Manor | Disneyland Park | 10 min | 10 | 1.00 | 0% |
| Hyperspace Mountain | Disneyland Park | 30 min | 30 | 1.00 | 0% |
| Star Tours | Disneyland Park | 10 min | 10 | 1.00 | 0% |
| Blanche-Neige et les Sept Nains | Disneyland Park | 20 min | 20 | 1.00 | 0% |
| Indiana Jones and the Temple of Peril | Disneyland Park | 20 min | 20 | 1.00 | 0% |
| Avengers Assemble: Flight Force | Adventure World | 15 min | 15 | 1.00 | 0% |
| Spider-Man W.E.B. Adventure | Adventure World | 35 min | 40 | 0.88 | 0% |
| Crush’s Coaster | Adventure World | 60 min | 70 | 0.86 | 38% |
| RC Racer | Adventure World | 30 min | 35 | 0.86 | 0% |
| Tower of Terror | Adventure World | 25 min | 30 | 0.83 | 0% |
Full series: the thirteen attractions with enough of a sample, between 53 and 60 days of data each. The days-above-90-minutes indicator reads 0% in all thirteen.
No attraction at Disney Adventure World rises at Christmas: four fall and one stays flat. Every one that rises is in Disneyland Park. At Christmas, people go where Christmas is: the tree, Main Street, the parade, the castle. The second park stays, in relative terms, emptier than on a normal day of the year. As we will see later, though, that could change this year, since shows are also expected in the kingdom of Arendelle.
And it is not the cold. The convenient explanation would be “in December everyone heads for the indoor attractions”, but the data does not back it: Indiana Jones, which is outdoors and in Disneyland Park, holds exactly at its annual median, while RC Racer, also outdoors but at Adventure World, falls. What rules is the park, not the roof.
A warning about the ratio, because it misleads: It’s a small world doubles its median, but it goes from 5 to 10 minutes. It is still a cheap attraction. The two that genuinely cost you the day are Peter Pan’s Flight, 55 minutes on the median with nearly one day in four above the hour, and Crush’s Coaster, which even as one of the biggest relative decompressors is the most expensive in absolute terms: a 60-minute median and 38% of days above that figure. They are the only two in the sample that clear 60 minutes with any frequency; the other eleven, not on a single day.
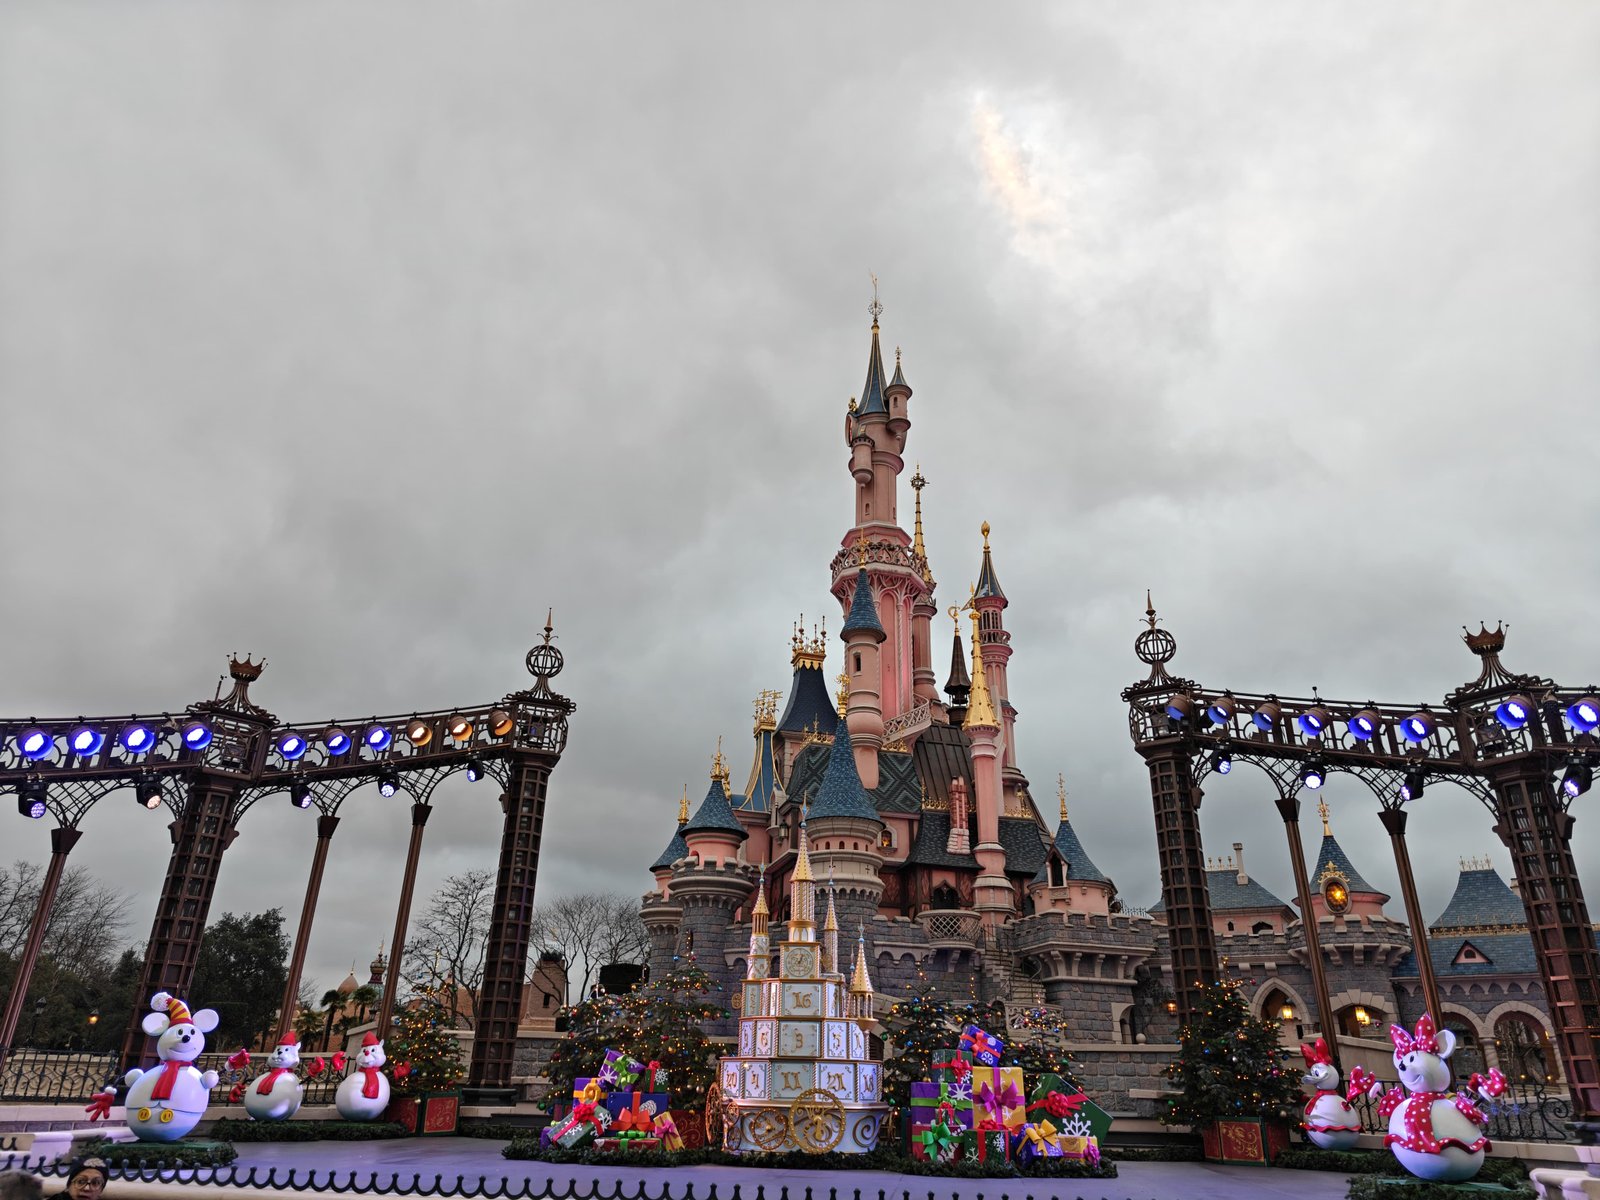
The Disneyland Paris castle with the stage and the Christmas decorations set up in front, under a winter sky.
What it costs to do the top 10
Translated into the only currency that matters inside the park, which is minutes:
| Period | Cost of the top 10 | Average wait per attraction | Attractions possible in 5 h |
|---|---|---|---|
| December 2024 | 279 min | 29 min | 10 |
| November 2024 | 262 min | 30 min | 10 |
| December 2025 | 242 min | 29 min | 10 |
| November 2025 | 204 min | 27 min | 11 |
December 2025 cost 242 minutes of accumulated queuing to do the ten main attractions: four long hours. November of the same year, 204. The 38-minute difference is exactly one more attraction in a five-hour afternoon. That is the real price of coming to see the tree in December instead of November, with the same decorations up: one attraction. But price matters too: a ticket in November (or the first days of December) can cost almost half what it costs in December.
A note from Verónica: Even though I have only visited the park once at Christmas (so far), I can say it is the most beautiful time of the year. The park transports you and inserts you (even more) into its magic. The dates were the end of November 2021, which falls outside these charts, but I can say the queues were not excessive and we were able to enjoy the park. This year we tried to go in the first days of January and the dates were sold out. Although the queues vary little across the season, the crowds do change, and financially it is better to arrive in the first days.
What to do with this if your dates are 26 December to 6 January
Here is the part that changes your day plan.
Split your days by intensity, not by park. If your stay crosses the turn of the year, your ride days come first and your atmosphere days come last. From 2 to 6 January the park is at its most expensive point of the whole season: that is when the parade, the shows, the shopping, the character meets and eating without rushing belong. Saving the “big day” for the end of the trip, which is what many people do out of tiredness, is exactly the opposite of what the data says.
If you travel on 24 or 25 December, that is your good day. An 11-minute average and a p90 of 30 make it the best day of the whole season for rides. Many people save it for “taking it easy”; the numbers say it is the day when getting up early pays off most.
Do not sacrifice the weekend. If your travel window includes a Saturday and you were thinking of leaving it for rest, in 2025 the Saturday median and the Tuesday median were identical at the Christmas peak.
And do not trust the average for the specific day. A 13-minute average does not mean there are no queues: it means many attractions are empty first thing and last thing, and a few eat your afternoon. The average describes the season; your day is decided minute by minute. Plan the day around the exact hours of each attraction, and only that way will you bring down the average wait for the attractions you want.
📱 That is where a historical average stops being useful and you need the live figure: knowing whether Peter Pan has dropped below 55 before you cross half the park, or whether it is worth moving over to Adventure World right now. MagicWait Paris gives you real-time wait times for both parks and a crowd forecast 90 days ahead. Access it free!
A warning before projecting this onto Christmas 2026/27
Everything above describes two seasons that have already closed. The next one, Disney’s Enchanted Christmas, runs from 7 November 2026 to 6 January 2027, and it arrives with one important difference from everything measured here: Disney has announced Christmas theming in Arendelle too, inside the new World of Frozen at Disney Adventure World.
That is new capacity and new appeal in the second park. The pattern of “park 1 fills, park 2 decompresses” that the 2025/26 data shows may shift for that reason, and it would be dishonest to present it as a fixed law. What is structural, because it depends on the European school calendar and not on the park, is the shape of the curve: the Epiphany window will remain the ceiling of the season.

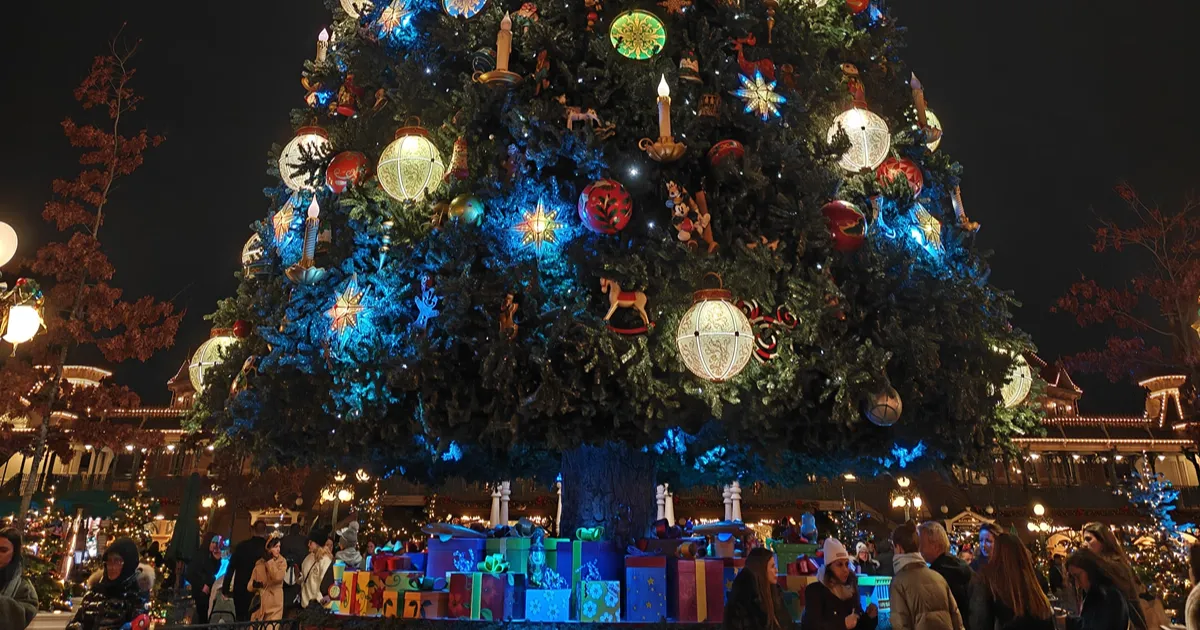
The Christmas decorations at night, with the tree lit in blue and a visitor contemplating them.
The concrete decision
If you can choose your dates, choose November with the decorations up: same lights, same tree, same parade, and 38 minutes less accumulated queuing on the top 10, which is one more attraction per afternoon.
If you cannot choose, which is the case for most people, the decision is a different one and it is made before you leave home: look at which days of your stay fall between 2 and 6 January and turn them into atmosphere days, not ride days. Move your queuing day to the 24th, the 25th or the first days of the week between the holidays. It is free, it does not depend on buying anything, and it is the difference between coming home saying “we never stopped queuing” and coming home having done what you wanted to do.
The data in this article comes from MagicWait Paris’s own historical database: 501,558 wait-time readings during the 2024/25 and 2025/26 Christmas seasons, across a total of more than 850 days of history.
Got fixed dates and want to know how this analysis would split your days? Write to us at hello@magicwaitparis.com with your travel window. And to see live what is a historical average here: MagicWait Paris.