Six months after opening, Frozen Ever After averages 63 minutes of wait in September. That is less than the 69 of April and far less than the 100 of its first three days, but it is still a lot: since Crush’s Coaster closed on September 7, Frozen is the attraction with the longest average queue in the whole of Disneyland Paris.
What has changed is the shape of the day. In its first month, the worst moment to go was opening: 106 minutes on average at 9:30, with half the park running towards Arendelle. In its sixth month, at 9:30 it posts 66 and the peak has moved to 11:00. And the evening has improved: 34 minutes at 20:30, against 53 in April.
And the novelty effect is wearing off, even if the absolute figure doesn’t show it: in April, Frozen’s wait was 2.25 times that of the other big rides in its park; in September, 1.6 times.
We measured it with 28,611 wait-time records for Frozen Ever After between March 29 and September 29, 2026: 185 days.
The data: what we measured and how
- What: the wait Disney posts for Frozen Ever After, recorded every five minutes while the attraction is open.
- Period: from March 29, 2026, opening day of Disney Adventure World and World of Frozen, to September 29. Readings from the preview days are left out.
- Comparison: to separate the novelty effect from the season effect, we compare Frozen with three big rides in the same park that have complete data for 2025 and 2026: Ratatouille, Avengers Assemble: Flight Force and Tower of Terror. Crush’s Coaster is left out of that comparison because it closed on September 7.
- Limit: our series starts in 2024, so we don’t have the opening of any other big attraction to compare novelty curves. The comparison is with the rest of the park, not with another launch.
Month by month
| Period | Average | Median | Worst 10% (P90) | Readings of 60 min or more | Readings of 90 min or more | Average daily peak | Days with a 120 min peak or more | Days |
|---|---|---|---|---|---|---|---|---|
| Mar 29-31 | 100 min | 90 min | 170 min | 85% | 59% | 217 min | 3 | 3 |
| April | 69 min | 70 min | 100 min | 72% | 21% | 116 min | 17 | 30 |
| May | 67 min | 70 min | 95 min | 69% | 18% | 109 min | 13 | 31 |
| June | 60 min | 60 min | 85 min | 59% | 9% | 97 min | 2 | 30 |
| July | 54 min | 55 min | 75 min | 44% | 3% | 90 min | 2 | 31 |
| August | 59 min | 60 min | 80 min | 55% | 7% | 94 min | 4 | 31 |
| September (1-29) | 63 min | 60 min | 90 min | 62% | 13% | 106 min | 9 | 29 |
Posted wait for Frozen Ever After. n = 28,611 records over 185 days (between 4,228 and 4,887 per month; 392 over the three days in March). Cutoff: September 29, 2026.
On opening day, March 29, the average wait was 127 minutes, with a peak of 240 at 10:00. The next day, 101 on average and a peak of 230. From there, the queue drops month by month until July, the best month of the six, and rises again in August and September.
That final rise is not Frozen gaining strength back. It is the whole park, as the next table shows.
Has the novelty effect worn off?
| Month | Frozen | Average of Ratatouille, Flight Force and Tower (2026) | Frozen ÷ that average | Same three rides, same dates in 2025 | Difference 2026-2025 |
|---|---|---|---|---|---|
| Mar 29 - Apr 30 | 71 min | 32 min | 2.25 | 32 min | 0 |
| May | 67 min | 29 min | 2.27 | 25 min | +5 |
| June | 60 min | 35 min | 1.72 | 27 min | +8 |
| July | 54 min | 31 min | 1.73 | 26 min | +6 |
| August | 59 min | 32 min | 1.86 | 23 min | +8 |
| September (1-29) | 63 min | 39 min | 1.60 | 26 min | +14 |
Average of the three attractions weighted equally. Ratios calculated without rounding.
Two movements at once. Frozen has cut its lead over the others: from waiting more than double what they wait to waiting 1.6 times as much. And at the same time, from May to September, the other big rides at Disney Adventure World have waited between 5 and 14 minutes longer than on the same dates in 2025. The new park draws more people, and those people spread out.
The honest reading: the novelty effect is diluting, but Frozen hasn’t become a normal attraction. From September 7 to 29, with Crush’s closed, its 63-minute average is ahead of Peter Pan’s Flight (58), Ratatouille (54) and Big Thunder Mountain (51).
The good hour has changed
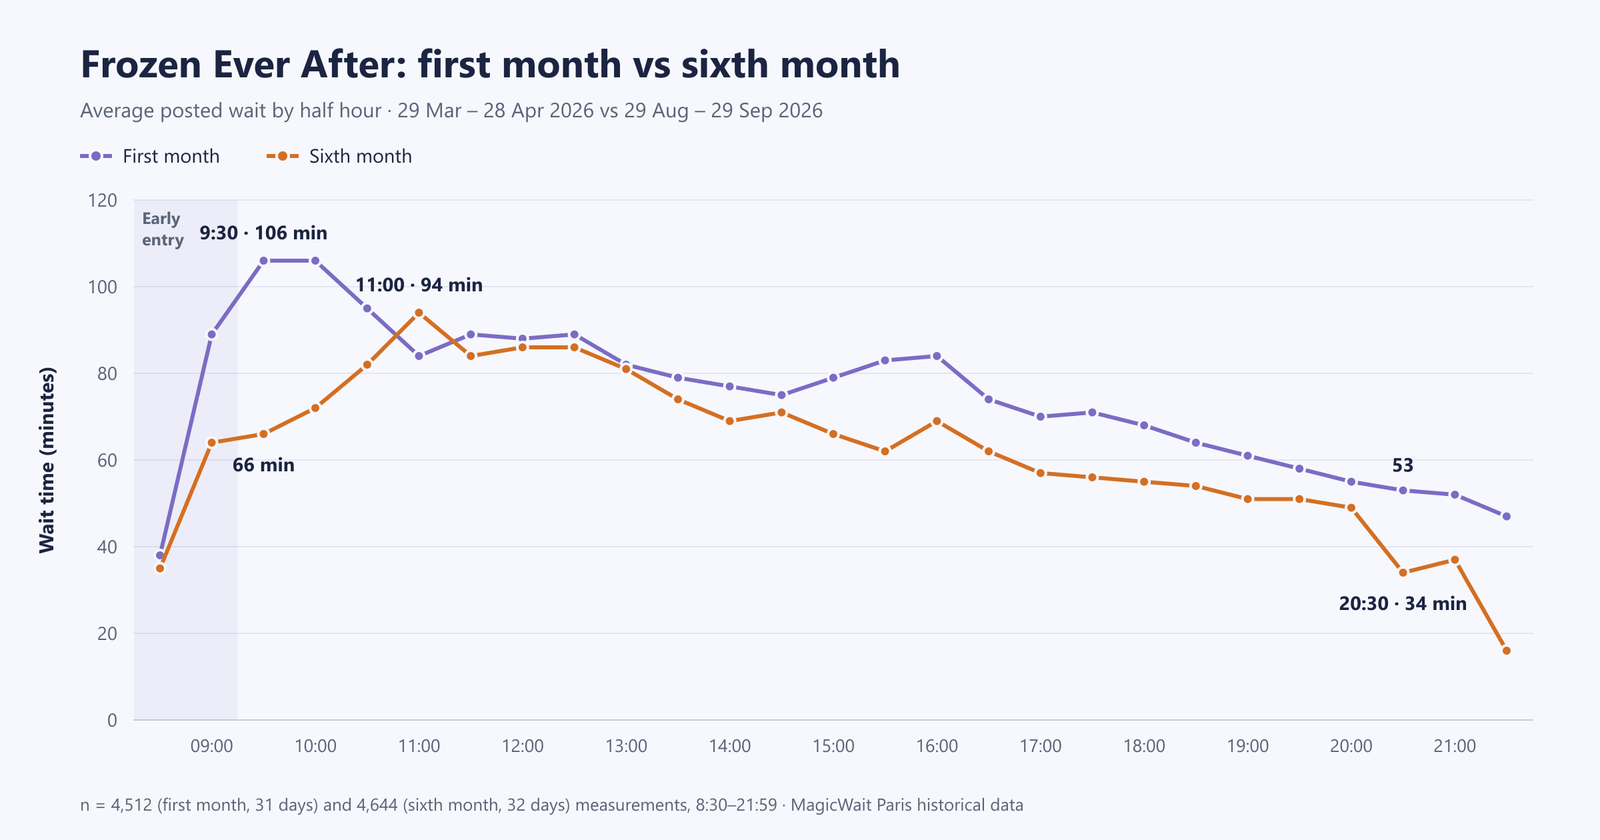
Average wait by half-hour slot: first month peak of 106 minutes at 9:30, sixth month peak of 94 at 11:00 and 34 minutes at 20:30.
| Slot | First month | Months 2 to 5 | Sixth month |
|---|---|---|---|
| 8:30 (early access) | 38 min | 32 min | 35 min |
| 9:30 (general opening) | 106 min | 68 min | 66 min |
| 10:00 | 106 min | 73 min | 72 min |
| 11:00 | 84 min | 79 min | 94 min |
| 12:00 | 88 min | 79 min | 86 min |
| 14:00 | 77 min | 66 min | 69 min |
| 17:00 | 70 min | 59 min | 57 min |
| 19:00 | 61 min | 54 min | 51 min |
| 20:30 | 53 min | 47 min | 34 min |
First month: March 29 to April 28 (n = 4,512). Months 2 to 5: April 29 to August 28 (n = 18,295). Sixth month: August 29 to September 29 (n = 4,644). Readings between 8:30 and 21:59.
The opening rush no longer pays off the way it did in April. In the first month, anyone entering at 9:30 and running to Frozen found the worst queue of the day. Today they find 66 minutes, which is still a lot, but it is no longer the worst moment: the peak has shifted to 11:00.
The evening is the new window. At 20:30, the sixth month posts 34 minutes, almost 20 fewer than in April. It is the lowest slot of those that exist every day; later, there is only data from days with a late closing.
Early access is still the best moment, but it is not a gentle stroll. At 8:30, between 32 and 38 minutes on average across the six months. Better than any hour of the day, but far from walking straight on.
On 151 of the 185 days, Frozen’s daily peak fell between 9:00 and 12:59. The day of the week, by contrast, barely matters: between 58 minutes on average on Friday and 65 on Thursday.
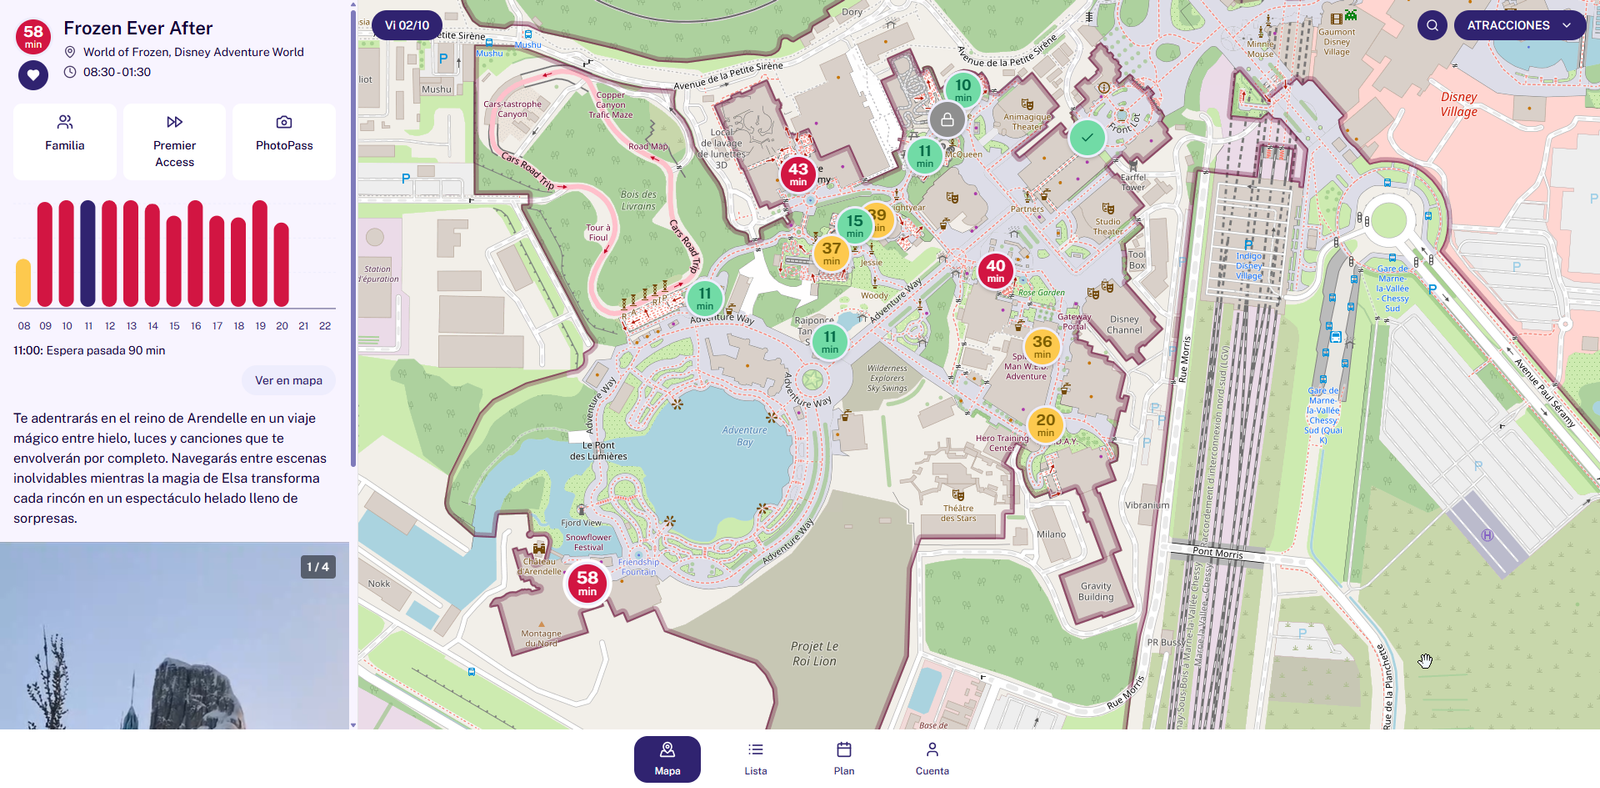
The MagicWait Paris map with live waits. Frozen Ever After marked at 58 minutes over World of Frozen.
Single Rider, breakdowns and late openings
If you are going as adults or teenagers and don’t mind riding separately, the Single Rider line is still the great free alternative:
| Month | Regular line (11:00-16:00) | Single Rider (11:00-16:00) |
|---|---|---|
| April | 80 min | 42 min |
| May | 80 min | 41 min |
| June | 72 min | 40 min |
| July | 66 min | 34 min |
| August | 71 min | 34 min |
| September | 76 min | 43 min |
Posted wait in both lines in the same readings, between 11:00 and 15:59. Between 1,634 and 1,795 readings per month.
In the middle hours, Single Rider saves between 32 and 39 minutes on average, every month.
The other face of a new and complex attraction: it stops. According to our breakdown analysis, Frozen had at least one unscheduled stop of 30 minutes or more on 41% of days, spent 6.1% of its schedule stopped and opened more than half an hour late relative to its usual time on 10% of days. If it stops, 42% of the stoppages are resolved within half an hour and 75% within an hour: do something nearby and check again.
What this means for your day
Take a family going to Disney Adventure World this autumn or winter with Frozen as a must-do:
- If you are staying at a Disney hotel: Frozen at 8:30, during early access. Count on about 35 minutes, not on walking straight on. And have a plan B: one in ten days it opens late.
- If you don’t have early access: don’t run to Frozen at 9:30 thinking of the April videos. Today that run costs you 66 minutes on average. The best option is the last hour and a half of the day. Note: in winter the park closes earlier, so the window moves forward with the closing time.
- If you don’t mind riding separately: Single Rider in the middle hours, around 40 minutes.
- If you are going to pay for a Premier Access, make it this one. Frozen is still the attraction where each euro buys the most minutes, as we explain in our Premier Access analysis.
- The day of the week, forget it: between the best and the worst there are 7 minutes.
Verónica’s note: Single Rider option… no doubt!
In March we got in early with no queue… and it was a treat! But of course that was something special and not the norm, and this summer we had to do the attraction with the “regular queue”. We rode twice. The first time we paid for the Premier Access and got through pretty fast, I don’t think we went over 10 minutes of waiting. It is expensive, true, but it was the way to ride all together with small children.
The second time we did Single Rider. If you are going with older children and adults, I see it as clearly the best option. The boats are big, so it is easy to end up sitting in the same boat as someone from your group (in our case there were 6 of us and we rode 2-1-3). It is true that we were waiting around 30 minutes, but nothing compared with the 70 showing in the regular queue. The attraction is well worth it and it is a very good way to enjoy it in company.
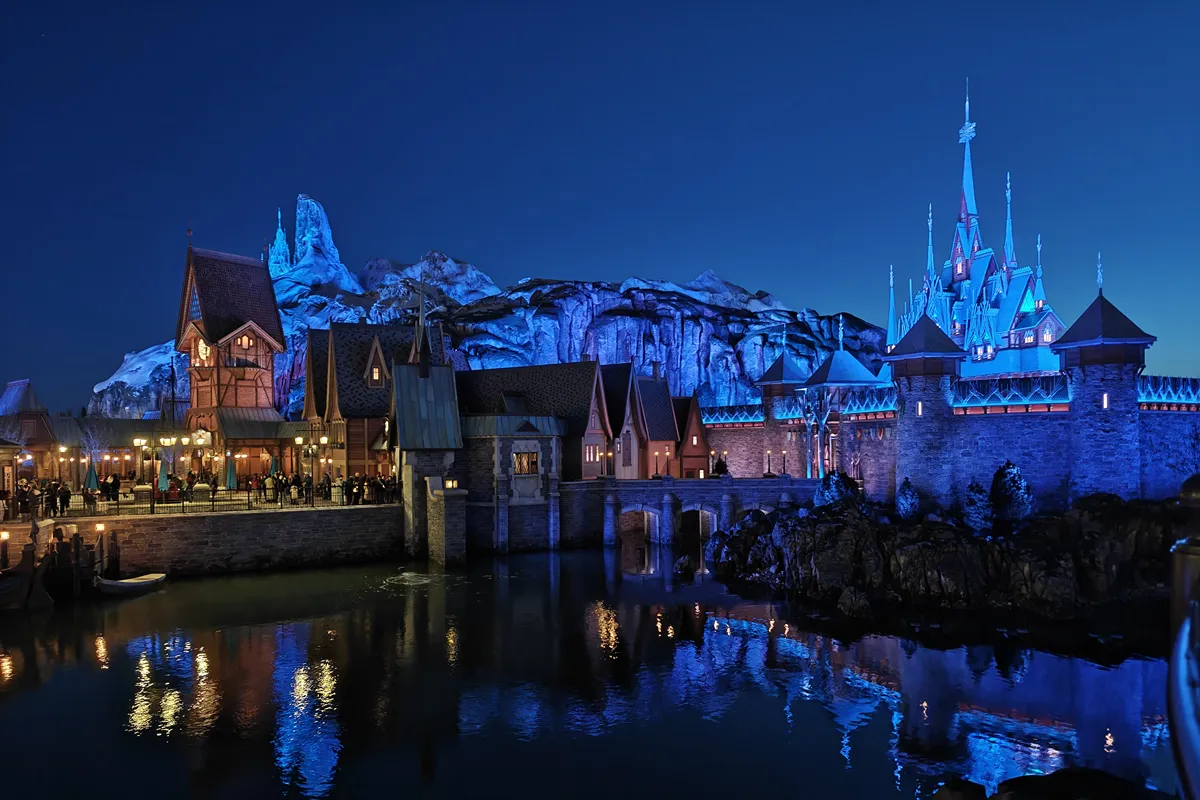
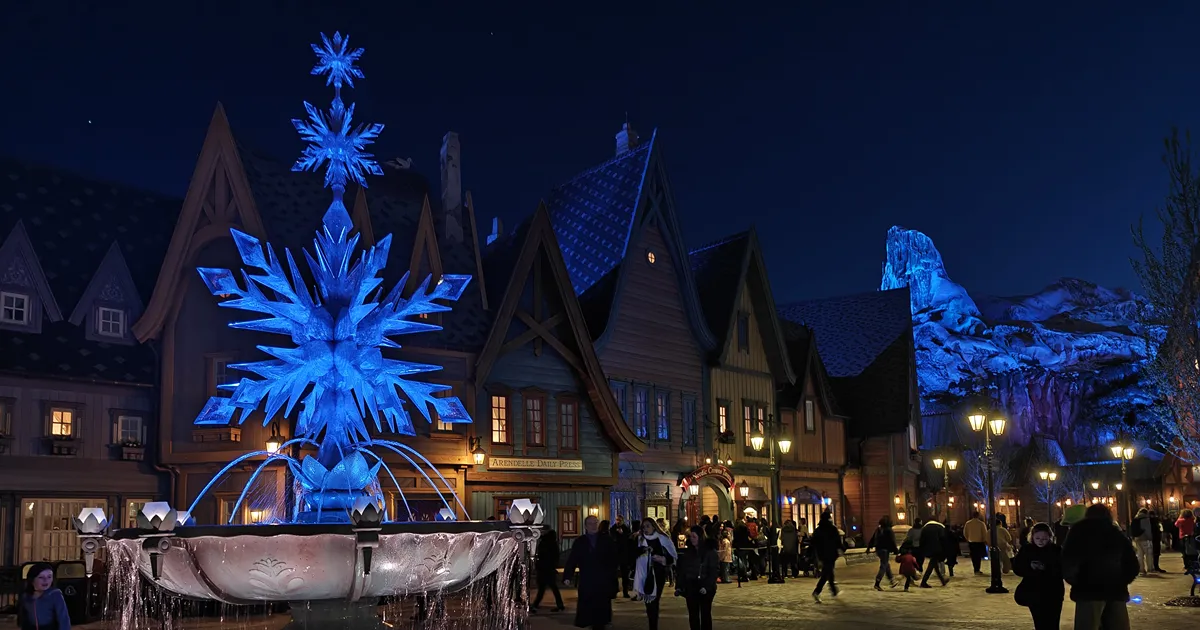
Arendelle’s castle and village at night in World of Frozen, with the lights reflected in the water.
The decision
Frozen Ever After is no longer the April madness, but it is not just another attraction either: 63 minutes on average in September and the longest queue in the resort while Crush’s stays closed. What has changed is the hour. If you don’t have early access, stop running to Frozen at 9:30 and move it to the last hour and a half of the day; if you do, go at 8:30 and count on a good half hour. And if your plan allows for neither, that is where Premier Access is justified.
Going on a fixed date and want to know how to fit Frozen into your day? Write to us at hello@magicwaitparis.com. And to see its queue live before crossing the park, MagicWait Paris.