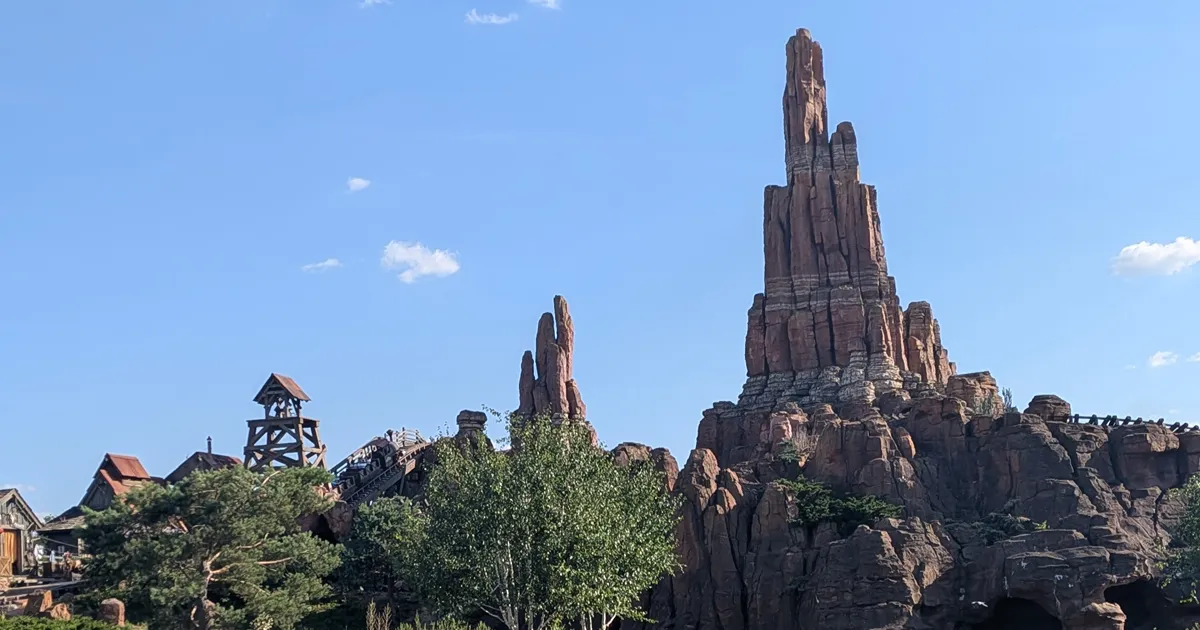
Big Thunder Mountain has at least one unplanned stoppage of half an hour or more on 59% of the days it opens: six days in ten. It’s the ride that stops the most at Disneyland Paris, ahead of Ratatouille (55%), Crush’s Coaster (42%), Frozen Ever After (41%), and Indiana Jones (40%). At the other end, Tower of Terror (3%) and Star Tours (1%) almost never stop.
But what really changes your day isn’t how often a ride stops, but how long it takes to come back. 82% of Spider-Man’s stoppages are resolved in half an hour or less. At Big Thunder, only 26%. And when a ride reopens, the posted queue doesn’t spike right away: it drops. That’s the best moment to get in, not the worst.
We measured it with 6,564 unplanned stoppages across 36 rides in the two parks, from October 1, 2025 to September 30, 2026: 144,105 operating hours.
What counts as a stoppage
- Stoppage: the ride goes from open to closed and reopens the same day, between its first and last opening. Two cuts separated by less than 10 minutes count as one.
- What we leave out: scheduled refurbishments (Ratatouille was closed from October 13, 2025 to March 27, 2026, for example), days when a ride never opened, and gaps with no data.
- Chain closures: when four or more rides in the same park stop at the same time, it isn’t a failure of one specific ride. Those are storms, extreme heat, nighttime events, or general incidents. There were 740 (10% of the total) and we set them aside from the ranking.
- What we measure and what we don’t: we record the status Disney publishes every five minutes. We see the closures you see from the ride entrance, not the two-minute pauses mid-ride. And we don’t know the cause of each stoppage: Disney doesn’t publish it.
The full ranking
| Ride | Days with a stoppage of 30 min or more | Stoppages per 100 h open | Time stopped | Median duration | Days analyzed |
|---|---|---|---|---|---|
| Big Thunder Mountain | 59% | 8.7 | 8.9% | 65 min | 353 |
| Ratatouille | 55% | 7.6 | 6.0% | 45 min | 199 |
| Crush’s Coaster | 42% | 8.0 | 4.8% | 30 min | 337 |
| Frozen Ever After | 41% | 8.0 | 6.1% | 45 min | 188 |
| Indiana Jones and the Temple of Peril | 40% | 5.4 | 4.7% | 40 min | 351 |
| Phantom Manor | 38% | 5.7 | 3.8% | 40 min | 353 |
| Star Wars Hyperspace Mountain | 31% | 4.1 | 4.3% | 60 min | 348 |
| Buzz Lightyear Laser Blast | 31% | 8.0 | 3.5% | 15 min | 285 |
| Spider-Man W.E.B. Adventure | 28% | 13.8 | 4.9% | 10 min | 365 |
| Casey Jr. | 26% | 6.9 | 4.0% | 30 min | 359 |
| Avengers Assemble: Flight Force | 24% | 7.2 | 3.4% | 10 min | 355 |
| Pirates of the Caribbean | 23% | 3.5 | 2.9% | 40 min | 346 |
| Les Voyages de Pinocchio | 21% | 6.8 | 3.2% | 25 min | 352 |
| Cars ROAD TRIP | 20% | 5.0 | 3.3% | 30 min | 350 |
| Blanche-Neige et les Sept Nains | 19% | 9.0 | 4.0% | 20 min | 242 |
| Le Pays des Contes de Fées | 19% | 3.5 | 5.6% | 55 min | 354 |
| Peter Pan’s Flight | 16% | 5.5 | 2.7% | 20 min | 346 |
| Slinky Dog Zigzag Spin | 14% | 3.6 | 2.9% | 25 min | 339 |
| Toy Soldiers Parachute Drop | 12% | 4.0 | 2.7% | 20 min | 344 |
| Les Tapis Volants | 11% | 4.0 | 2.9% | 20 min | 364 |
| Cars Quatre Roues Rallye | 10% | 4.8 | 2.1% | 15 min | 365 |
| RC Racer | 9% | 3.9 | 1.8% | 15 min | 359 |
| Autopia | 8% | 0.8 | 2.1% | 80 min | 364 |
| It’s a small world | 7% | 1.9 | 0.8% | 15 min | 353 |
| Railroad: Frontierland Depot | 6% | 4.1 | 2.2% | 15 min | 327 |
| Raiponce Tangled Spin | 6% | 4.0 | 2.1% | 20 min | 188 |
| La Cabane des Robinson | 6% | 4.0 | 1.0% | 5 min | 363 |
| Dumbo the Flying Elephant | 5% | 1.9 | 1.9% | 20 min | 341 |
| Railroad: Main Street Station | 5% | 4.1 | 2.1% | 15 min | 331 |
| Mad Hatter’s Tea Cups | 5% | 1.7 | 1.2% | 20 min | 352 |
| Orbitron | 4% | 1.5 | 0.9% | 10 min | 355 |
| Alice’s Curious Labyrinth | 4% | 1.2 | 0.7% | 25 min | 304 |
| Tower of Terror | 3% | 0.7 | 0.4% | 20 min | 365 |
| Le Carrousel de Lancelot | 2% | 2.6 | 0.8% | 15 min | 346 |
| Les Mystères du Nautilus | 2% | 0.3 | 0.3% | 15 min | 365 |
| Star Tours | 1% | 0.3 | 0.1% | 15 min | 339 |
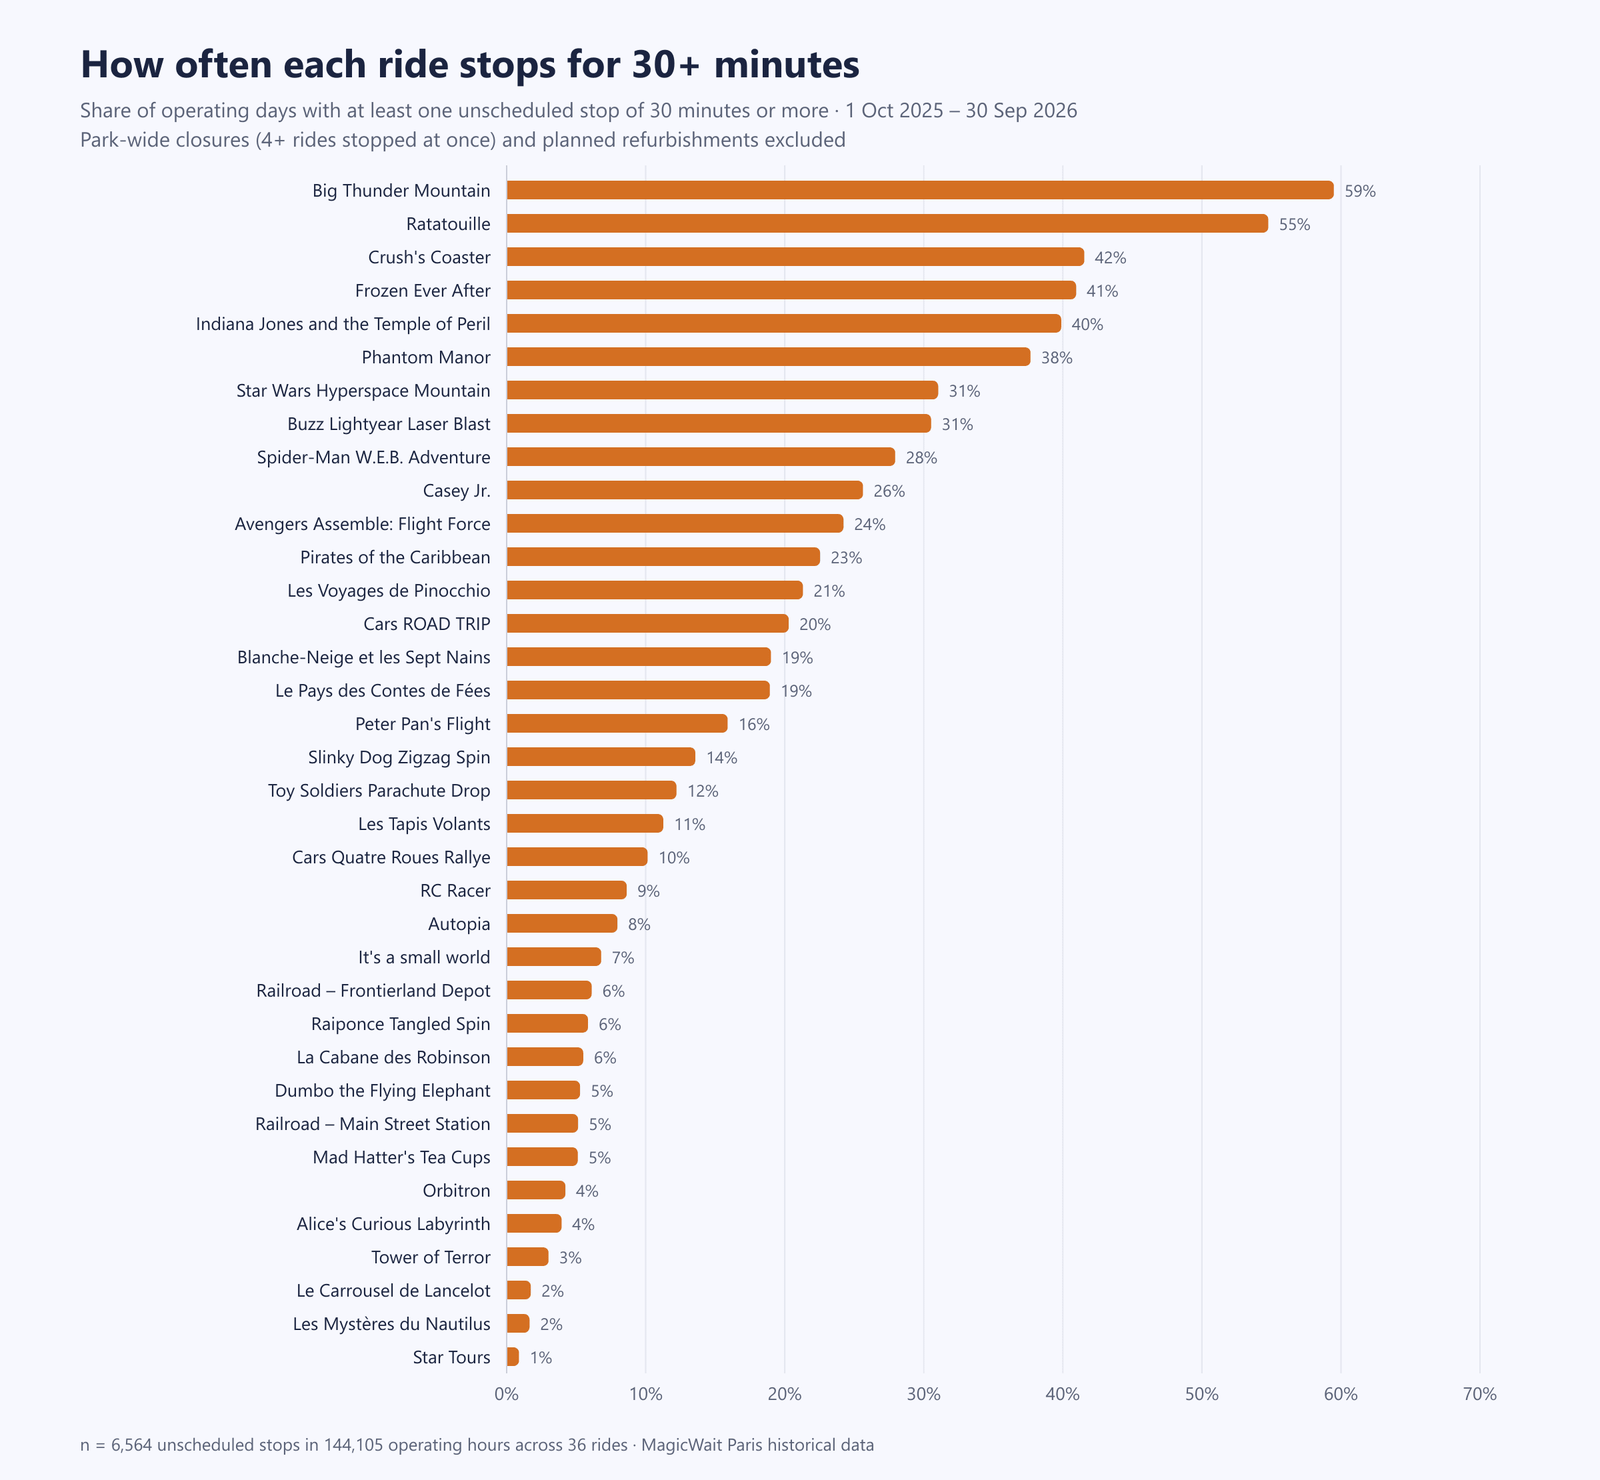
Unplanned stoppages, from October 1, 2025 to September 30, 2026, without chain closures or refurbishments. “Time stopped” is the percentage of its operating schedule that a ride spent closed. Frozen Ever After and Raiponce, since their opening in March 2026; Crush’s Coaster, up to its closure on September 7. n = 6,564 stoppages over 144,105 hours.
Three readings that don’t jump out at first glance:
Big Thunder Mountain is in another league. It spends 8.9% of its schedule stopped, its stoppages last a median of 65 minutes, and only one in four is resolved within half an hour. Counting chain closures too, if you arrive at its entrance at any random moment you’ll find it closed one time in ten. It’s the same ride that has no good hour for its queue: it costs a lot when it works and it fails more than any other.
Spider-Man stops often, but briefly. It accumulates the most stoppages (13.8 per 100 hours open, some stoppage on 85% of days), but the median is 10 minutes. That’s why, on days with a stoppage of half an hour or more, it ranks ninth.
Phantom Manor is a surprise. A stoppage of 30 minutes or more on 38% of days, with a median of 40 minutes. These aren’t the short pauses for wheelchair boarding, which don’t show up as a closure: these are real stoppages.
Wait or leave?
When you reach a ride and it’s stopped, the question is whether to stay nearby or change plans. This is how long they take to come back:
| Ride | Back in 30 min or less | In 60 min or less | More than 2 hours | Stoppages |
|---|---|---|---|---|
| Spider-Man W.E.B. Adventure | 82% | 89% | 1% | 661 |
| Peter Pan’s Flight | 75% | 90% | 2% | 250 |
| Avengers Assemble: Flight Force | 71% | 87% | 2% | 336 |
| Buzz Lightyear Laser Blast | 65% | 92% | 2% | 307 |
| Crush’s Coaster | 46% | 90% | 3% | 357 |
| Pirates of the Caribbean | 43% | 59% | 4% | 152 |
| Frozen Ever After | 42% | 75% | 5% | 203 |
| Phantom Manor | 39% | 83% | 1% | 254 |
| Star Wars Hyperspace Mountain | 31% | 51% | 8% | 194 |
| Indiana Jones and the Temple of Peril | 28% | 82% | 4% | 239 |
| Big Thunder Mountain | 26% | 42% | 2% | 413 |
| Ratatouille | 20% | 81% | 2% | 204 |
| All rides | 61% | 83% | 4% | 6,564 |
Unplanned stoppages without chain closures, from October 1, 2025 to September 30, 2026.
The rule that comes out of this:
- Wait nearby if Spider-Man, Peter Pan’s Flight, Flight Force, or Buzz Lightyear stops: between two in three and four in five stoppages are resolved within half an hour.
- Leave and come back later if Big Thunder Mountain or Hyperspace Mountain stops: 58% and 49% of their stoppages last more than an hour.
- Frozen, Ratatouille, Indiana Jones, and Phantom Manor sit in the middle: if they come back, it’s usually within the hour. Do something nearby and check again in 30-45 minutes.
When it reopens, get in right away
There’s a widespread idea: when a ride reopens, everyone runs toward it and it’s better to wait an hour. Our data says the opposite.
| Ride | Wait before the stoppage | At reopening | 30 min later | 60 min later |
|---|---|---|---|---|
| Big Thunder Mountain | 49 min | 33 min | 54 min | 56 min |
| Star Wars Hyperspace Mountain | 30 min | 15 min | 37 min | 38 min |
| Spider-Man W.E.B. Adventure | 41 min | 29 min | 44 min | 43 min |
| Peter Pan’s Flight | 56 min | 44 min | 56 min | 57 min |
| Ratatouille | 51 min | 44 min | 60 min | 58 min |
| Frozen Ever After | 68 min | 66 min | 76 min | 77 min |
| All rides | 31 min | 24 min | 33 min | 35 min |
Posted wait at stoppages of 15 minutes or more with data before and after: n = 3,778 stoppages (311 at Big Thunder, 131 at Hyperspace, 186 at Spider-Man, 170 at Peter Pan, 160 at Ratatouille, 109 at Frozen).
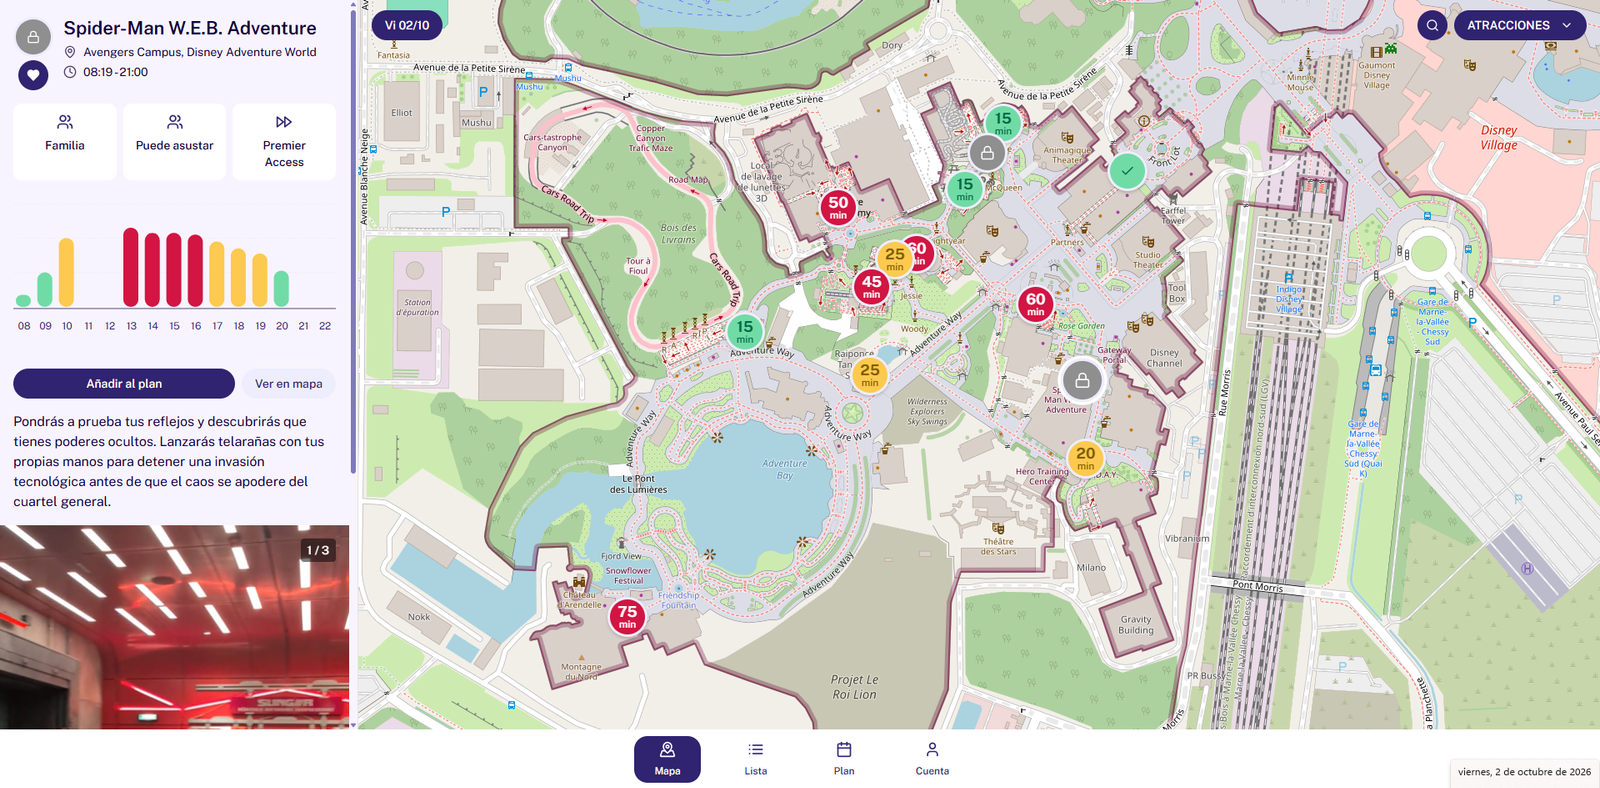
MagicWait Paris screenshot (Friday, October 2, 2026): the Spider-Man W.E.B. Adventure page with the hourly wait chart and the park map showing the status of every ride.
Right at reopening, the posted wait is the lowest of the whole sequence: 16 minutes less than before the stoppage at Big Thunder, 15 less at Hyperspace. Half an hour later it’s already above where it started. The “backfill effect” is real, but it arrives afterwards, not before: whoever waits an hour for things to calm down finds the longer queue.
An honest caveat: we measure the wait Disney posts, not the one you time yourself. If many people arrive at once when it reopens, the real wait can be somewhat higher than the posted one. Even so, the trend is the same on every ride.
The first hour is the most fragile
Stoppages starting in each hour of the day, per 100 operating hours:
| Hour | Stoppages per 100 h | Measured operating hours |
|---|---|---|
| 8:00 | 7.9 | 2,453 |
| 9:00 | 5.1 | 8,555 |
| 10:00 to 17:00 | 4.4-5.0 | 93,389 |
| 18:00 and 19:00 | 4.1-4.4 | 21,644 |
| 20:00 | 3.9 | 9,437 |
| 21:00 | 3.6 | 6,327 |
| 22:00 | 2.2 | 2,172 |
Unplanned stoppages without chain closures, by start time.
The first operating hour, which for the big rides coincides with hotel early access, has almost 70% more stoppages than the central hours (7.9 versus 4.7 per 100 hours). And some rides simply open late: Frozen Ever After opened more than half an hour after its usual time on 10% of days; Big Thunder Mountain, 7%; Ratatouille, 7%; Spider-Man, 6%. Peter Pan’s Flight, only 0.9%.
If your plan depends on running to Frozen or Big Thunder the moment it opens, have your second option planned before you arrive.
Weather and the calendar
- The day of the week makes no difference: between 2.7% and 2.9% of operating time stopped, Monday through Sunday.
- The month matters mainly because of the heat: from October to May and in September, rides spend between 2.4% and 3.6% of their schedule stopped. In July and August, above 4%. In June 2026, 7.1%, with 38°C on June 24 and 25. Of the 166 stoppages lasting more than four hours that year, 127 fell on days at 30°C or above. We cover it in detail in our heat wave analysis.
- Rain, heat, and wind set off chain closures on outdoor rides: with rain of 0.5 mm per hour or more they multiply by four; with 30°C or more, by five. The rides’ own stoppages rise only slightly (7% with rain and 14% with heat), except with wind gusts of 50 km/h or more, which push them up 29%. On indoor rides, rain barely moves anything, just like what happens with queues when it rains.
What this means for your day
Say you have a single day and three or four rides you don’t want to miss:
- Don’t leave Big Thunder, Ratatouille, or Frozen for the last slot of the day. With these stoppage probabilities, place them early and leave room for a second attempt.
- If it’s stopped when you arrive, check the wait-or-leave table. Spider-Man or Peter Pan: stay nearby. Big Thunder or Hyperspace: change areas.
- When it reopens, go in the first half hour. That’s when the posted wait is at its lowest.
- If you arrive first thing, have a plan B for the ride you’re running to.
- If you pay for Premier Access on one of these rides and it stops during your slot, check the official app at the time. We explain it in our Premier Access analysis.
A Note from Verónica: Don’t Let Breakdowns Ruin Your Day
The problem of ride stoppages, as we’ve seen in this article, is real and more frequent than we think. Stopping the ride for wheelchair boarding is very common, but that’s just a few minutes and it lets you enjoy the theming a little longer. Real closures, though, are genuinely annoying. I’ve seen many from the outside, and there have been days when I couldn’t ride Big Thunder Mountain, either because it was stopped or because when it reopened the queue was outrageous, and that’s the reality. Once we were evacuated from the ride and, since it happened at the end of the day, they gave us passes to come back the next day.
My advice: know the average downtime of the ride and keep an eye out for it reopening so you can get in. It’s true that the queue drops a lot at that moment, but in my experience it rises again afterwards. But don’t let closures become the central focus of your visit to DLP, because you’re going to get them. Always look for a plan B and understand that it’s very difficult for every ride to be open during your visit.
The decision
One in four stoppages at Big Thunder is resolved within half an hour; at Spider-Man, four in five. That difference is what decides whether you stay or leave. Place the fragile rides early and with margin, stay near only the ones that come back quickly, and when one reopens, go in within the first half hour: it’s the moment with the shortest queue, not the longest.
Have a fixed date and want to know how to cover yourself if your must-do ride stops? Write to us at hello@magicwaitparis.com. And to check whether it’s open before crossing the park, MagicWait Paris.