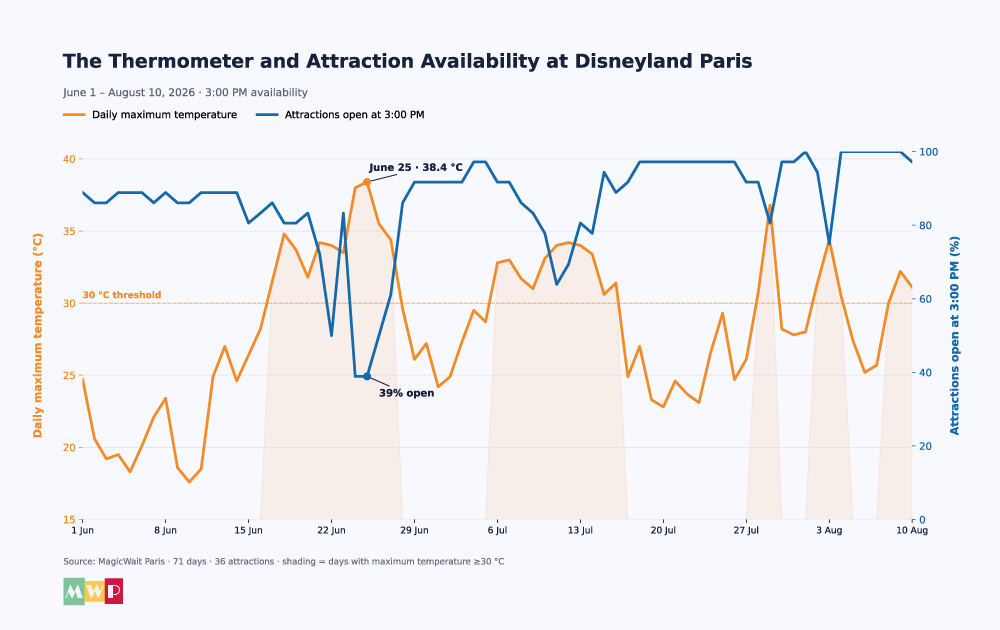
On June 25, 2026, with a high of 38.4°C, at 4:00 PM there were 23 of 36 attractions closed at Disneyland Paris. 64% of the park, shut down. By 9:00 PM, with the temperature already dropping, 25 were back open. This wasn’t a breakdown or bad luck: it was a pattern that repeated across all 30 days this summer that exceeded 30°C.
We analyzed 71 consecutive days (June 1 to August 10, 2026), 36 attractions across both parks, and roughly 6,900 daily status readings captured every five minutes. The conclusion: heat isn’t an environmental annoyance at Disneyland Paris. It’s the variable that determines what you can do and when.
The 2:00 PM Collapse: the park’s lineup gets cut in half
We compared two days from the same month: June 10 (high of 17.6°C) and June 25 (38.4°C, the hottest day in the period).
Attractions open by hour, out of 36 · n = 36 attractions · data MagicWait Paris
| Time | Jun 10 (17.6°C) | Jun 25 (38.4°C) |
|---|---|---|
| 09:00 | 30 | 28 |
| 12:00 | 30 | 18 |
| 14:00 | 31 | 14 |
| 16:00 | 31 | 13 |
| 18:00 | 32 | 13 |
| 21:00 | 29 | 25 |
At nine in the morning, both days are almost identical. By noon, twelve attractions are already down. By four in the afternoon, the park is operating at less than half its lineup. And at nine at night, twelve attractions recover all at once.
That last data point is the most revealing in the report: closures are reversible and follow the thermometer curve, not the maintenance schedule. In the 2:00 PM to 6:00 PM window on days ≥30°C, there was an average of 9.3 closed attractions, compared to 0 to 6 on normal days.
The exact threshold where each attraction drops
Not everything shuts down at once. The data paints a fairly sharp staircase:
| Threshold | What stops running |
|---|---|
| ~30°C | Disneyland Railroad (both stations analyzed) |
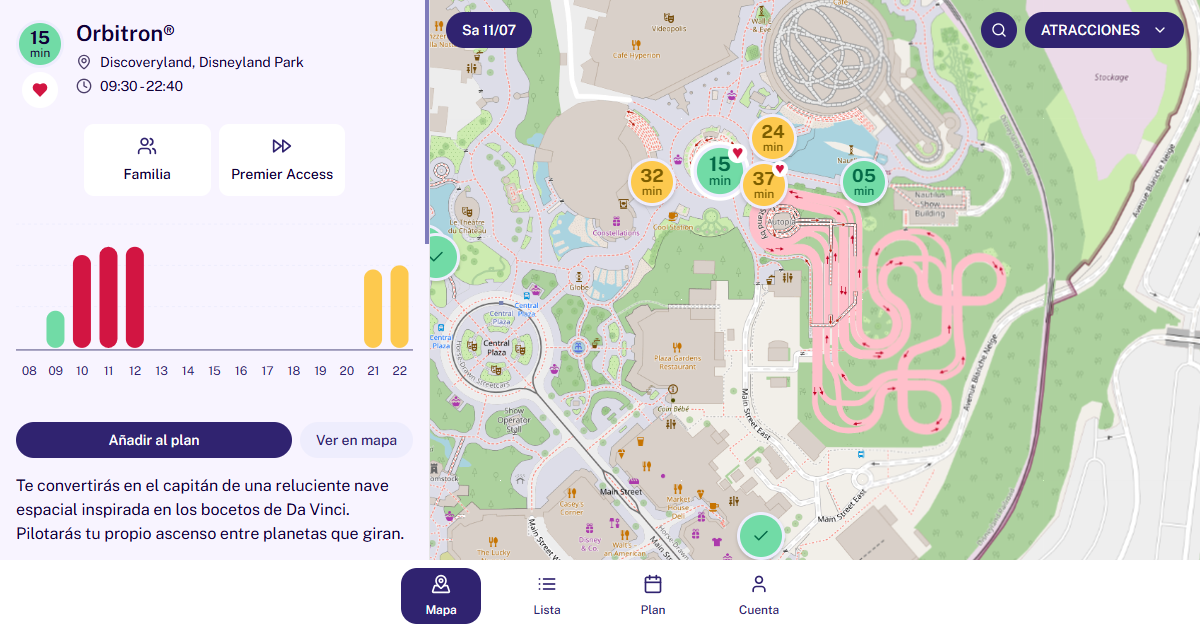
| ≥33°C | Autopia and Orbitron begin closing partially |
| ≥34°C | Le Pays des Contes de Fées, Dumbo the Flying Elephant, Les Tapis Volants, Toy Soldiers Parachute Drop, Raiponce Tangled Spin |
| ≥38°C | Near-total shutdown of outdoor attractions: 23 of 36 at peak |
Translated to closed attractions:
31°C → about 4
34°C → about 13
35°C → about 20
38°C → about 23.
Now look at that 34°C list through the eyes of a family with kids aged three to eight. Dumbo. Le Pays des Contes de Fées. Les Tapis Volants. Raiponce. That threshold doesn’t take down the teen roller coasters: it takes down the entire catalog of outdoor toddler attractions. An adult without kids visiting at 35°C loses three or four options; a family with a four-year-old loses half their visit.
📊 Heat doesn’t give warnings, but the data does. With MagicWait Paris you can see in real time which attractions are open and how long the wait is, so you don’t cross the park with a stroller only to find the ride closed. Access it free and plan with real information.
Days closed per attraction and their correlation with temperature
n = 34 operating attractions · 71 days · cutoff Aug 10, 2026
| Attraction | Days closed | Of which ≥30°C | Temperature range |
|---|---|---|---|
| Disneyland Railroad (Frontierland Depot) | 21 | 20 (95%) | 29.6 – 38.4°C |
| Disneyland Railroad (Main Street Station) | 21 | 20 (95%) | 29.6 – 38.4°C |
| Orbitron | 9 | 6 (67%) | 26.1 – 38.4°C |
| Autopia | 5 | 5 (100%) | 33.1 – 38.4°C |
| Le Pays des Contes de Fées | 5 | 5 (100%) | 34.0 – 38.4°C |
| Dumbo the Flying Elephant | 3 | 3 (100%) | 35.5 – 38.4°C |
| Cars Quatre Roues Rallye | 2 | 2 (100%) | 35.5 – 38.4°C |
| Les Tapis Volants | 2 | 2 (100%) | 38.0 – 38.4°C |
The counterintuitive finding: queues drop when the thermometer rises
This is where almost every summer guide gets it wrong. The global average queue for open attractions was 26.3 minutes on days below 25°C and 24.9 minutes on days at or above 30°C. In extreme heat, you expect less wait, not more.
Average queue by hour (minutes) — only hours with the attraction open, data MagicWait Paris
| Time | Days <25°C | Days ≥30°C | Difference |
|---|---|---|---|
| 09:00 | 16.2 | 17.1 | +1.0 |
| 10:00 | 25.3 | 26.5 | +1.2 |
| 11:00 | 31.2 | 31.3 | 0.0 |
| 12:00 | 35.3 | 32.7 | −2.6 |
| 13:00 | 34.7 | 31.8 | −2.9 |
| 14:00 | 32.1 | 30.1 | −2.0 |
| 15:00 | 31.6 | 29.1 | −2.5 |
| 16:00 | 31.0 | 27.0 | −4.1 |
| 17:00 | 29.2 | 25.7 | −3.5 |
| 18:00 | 27.0 | 24.9 | −2.1 |
| 19:00 | 23.8 | 22.6 | −1.2 |
| 21:00 | 18.0 | 18.9 | +0.9 |
Look at the shape of the curve: in the morning, heat does not save queue time (at 10:00 AM you actually wait a minute longer). The savings kick in from midday and peak at 4:00 PM, with 4.1 fewer minutes on average.
And that average lies by omission, because it’s calculated only on the attractions that were still open. Waiting less at thirteen rides isn’t better than waiting more at thirty-one.
Autopia, +34%: the afternoon trap
When the park shuts down the outdoor options, the demand doesn’t disappear. It shifts.
Average queue per attraction: days <25°C vs ≥30°C
| Attraction | <25°C | ≥30°C | Δ min | Δ % |
|---|---|---|---|---|
| Autopia | 37.5 | 50.2 | +12.7 | +34% |
| Cars ROAD TRIP | 17.6 | 22.4 | +4.7 | +27% |
| Disneyland Railroad (Main Street) | 27.4 | 28.9 | +1.5 | +5% |
| Tower of Terror | 36.8 | 29.2 | −7.6 | −21% |
| Frozen Ever After | 59.5 | 52.8 | −6.7 | −11% |
| Cars Quatre Roues Rallye | 14.2 | 10.4 | −3.7 | −26% |
| Les Tapis Volants | 14.6 | 11.2 | −3.4 | −23% |
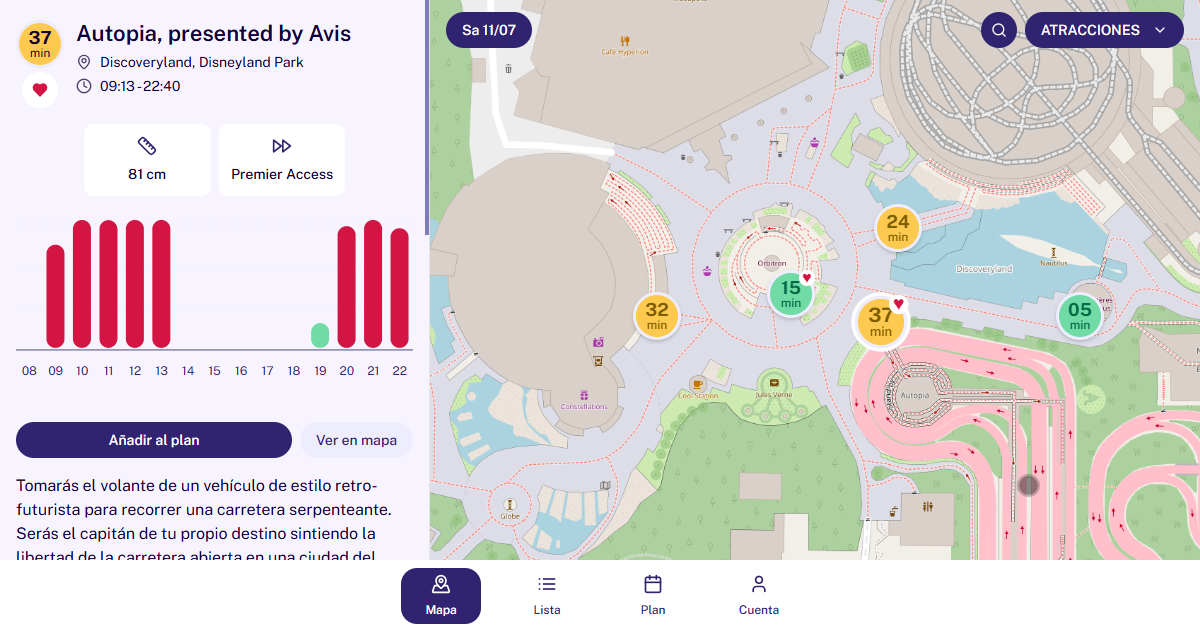
Autopia is one of the few outdoor family attractions that stays open up to 33°C, and it pays the price: twelve and a half more minutes of average queue on hot days. It’s exactly the attraction every family heads to right after finding Dumbo closed.
At the same time, the big indoor rides get cheaper. Tower of Terror drops 7.6 minutes of average wait and Frozen Ever After drops 6.7. Hot days deal the cards unfairly, but predictably: they penalize what stays open under the sun and reward what has a roof.
What this means for your day
Three concrete decisions come out of these numbers:
1. If the forecast is 34°C or above, outdoor toddler attractions are a race against noon. Dumbo, Le Pays des Contes de Fées, Les Tapis Volants, and Raiponce are at the 34°C threshold. If you leave them for after lunch, there’s a high chance you won’t ride them. It’s not “better in the morning”: it’s that by the afternoon they may simply not exist.
2. The afternoon isn’t for toughing it out, it’s for switching to indoor rides. The data shows Tower of Terror and Frozen Ever After have lower queues precisely during the hours when the sun hits hardest. The 2:00 PM to 6:00 PM window is the best time of the entire day for the big indoor attractions. Many visitors have already left, worn out by the heat, and it can be a great window to hit the indoor rides.
3. Avoid Autopia between 1:00 PM and 6:00 PM on hot days. This is the only recommendation in this article that goes against intuition: it looks like the obvious choice when everything else is closed, and that’s exactly why it’s the worst.
A note from Verónica
This summer, we got to “live” the park in the middle of a heat wave, and as a contrast, we also went on a few days with pleasant temperatures, and the difference was night and day.
Around 2:00 PM, attractions started closing and it was really hard to decide where to go. We had small kids with us, so roller coasters were out, and Big Thunder Mountain was closed for renovation, so we had very little to choose from.
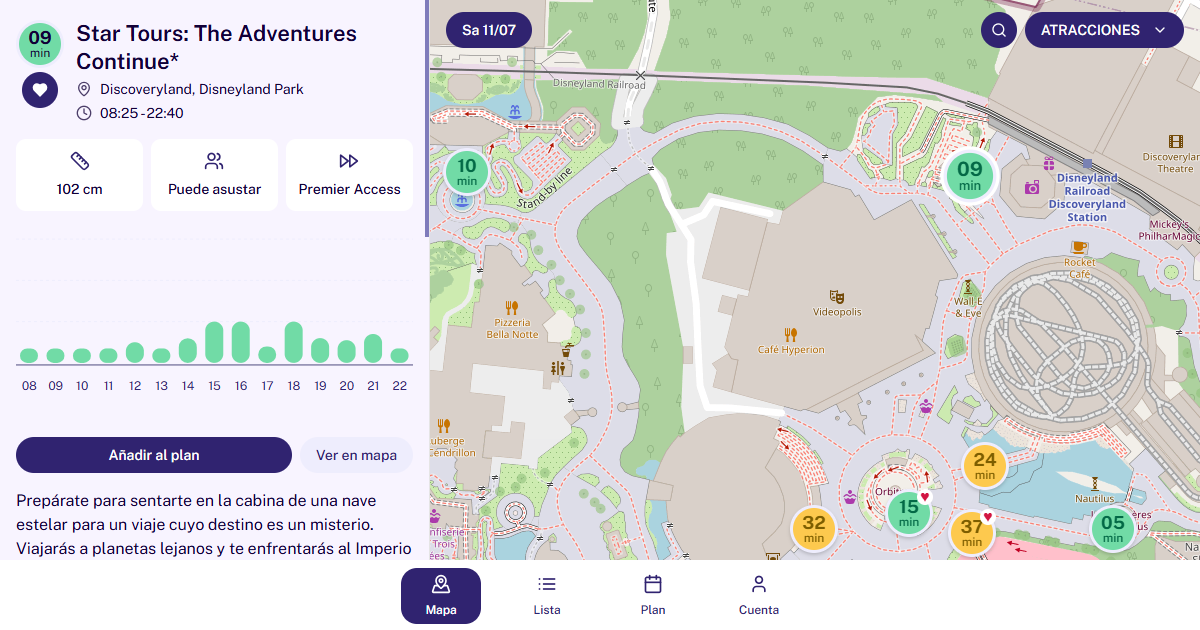
We got on Star Tours and used the moment to eat. We wanted to do rides like Pirates or It’s a Small World, but by then the queues had gone up and we decided to leave them for later (after 5:00 PM, when they showed green wait times).
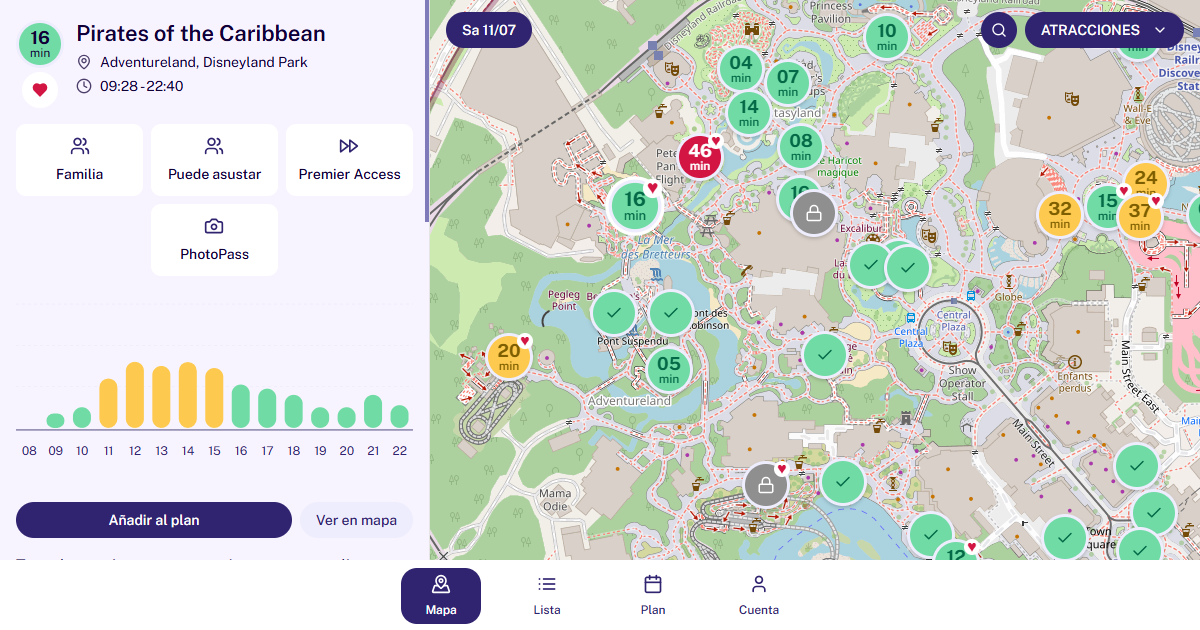
Two factors to keep in mind: overall, crowd levels those days were low (C), and from 5:00 PM onward visitors left the park en masse and things got fairly quiet. However, on the flip side, there were very few attractions open, so demand matched the wait times. There weren’t many unexpected queue spikes at attractions you wouldn’t expect.
What this data doesn’t cover
Methodological honesty, because the analysis has real limits:
- The thresholds aren’t a published policy. Disney doesn’t disclose at what temperature each attraction closes. These are the thresholds we observed over 71 days, not an official rule. A 34°C day with wind can behave differently than a 34°C day without it.
- The queue comparison only includes hours when the attraction was open, so it undervalues the real impact: it doesn’t count the minutes you spend unable to get on anything.
- The official context also changes other things. During the red alert in June 2026, nighttime shows were performed without fireworks due to fire risk, at the request of the Seine-et-Marne prefecture recorded in a decree, and Disney Tales of Magic ran without pyrotechnics, without drones, and without fountains, while Disney Cascade of Lights also lost its pyrotechnic effects. The parade gets shortened and some outdoor meet and greets are suspended. None of this shows up in our attraction metrics. But it’s also important to factor in.
The decision you have to make
Look at the high temperature forecast for your visit day and hold on to a single number:
- Below 30°C: normal day. Plan like any other summer day.
- Between 30 and 33°C: write off the Disneyland Railroad and don’t rely on it to get around with a stroller. It’s the first victim, starting at 29.6°C in our data.
- From 34°C up: reorganize the entire day. All outdoor toddler attractions, before 12:00 PM, no exceptions. The entire afternoon goes to the big indoor rides, which also have shorter queues than on a cool day. And Autopia, stay away from it until 6:00 PM.
A 38°C day isn’t a lost day: it’s a day where thirteen attractions have to deliver what thirty-one normally do. It goes well if you accept that at nine in the morning, and it goes badly if you discover it at four in the afternoon.
We keep capturing the status of all 36 attractions every five minutes. Check live wait times and crowd forecasts on MagicWait Paris, or write to us at hello@magicwaitparis.com if you want us to look at your specific dates.