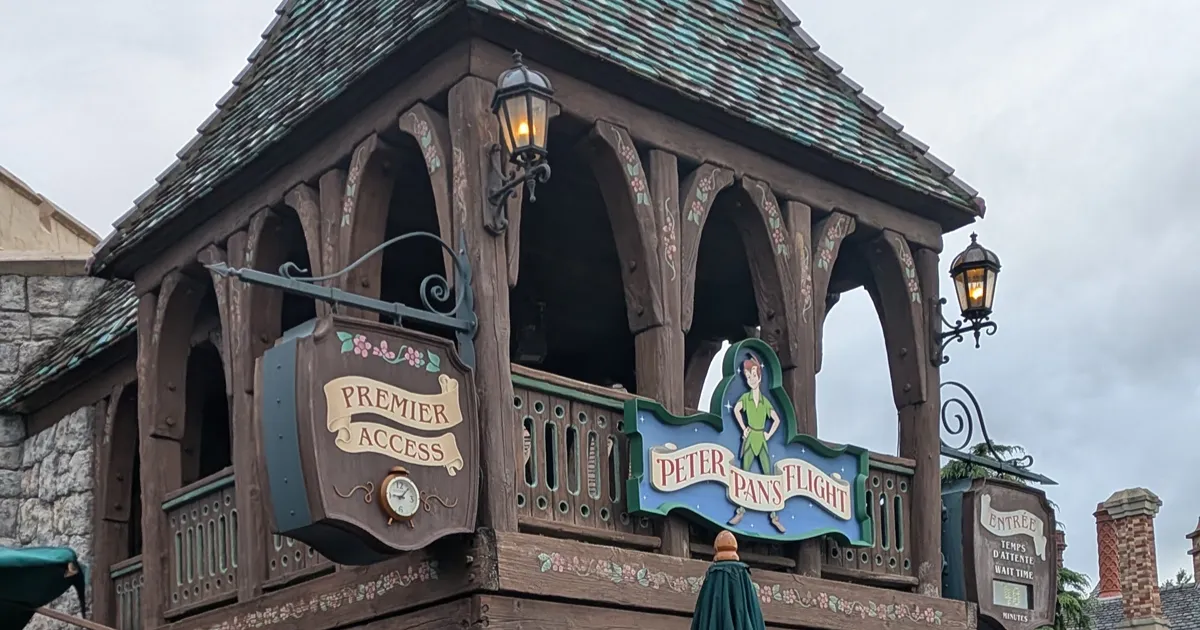
While Disney Stars on Parade goes by, Disneyland Park queues drop by 7 minutes compared with what they would show at that same time without a parade: 27% less. It happened in 344 of the 349 parades we measured. It is not a myth, but it is not the emptying people talk about either: Peter Pan’s Flight drops by 10 minutes and is still at 53.
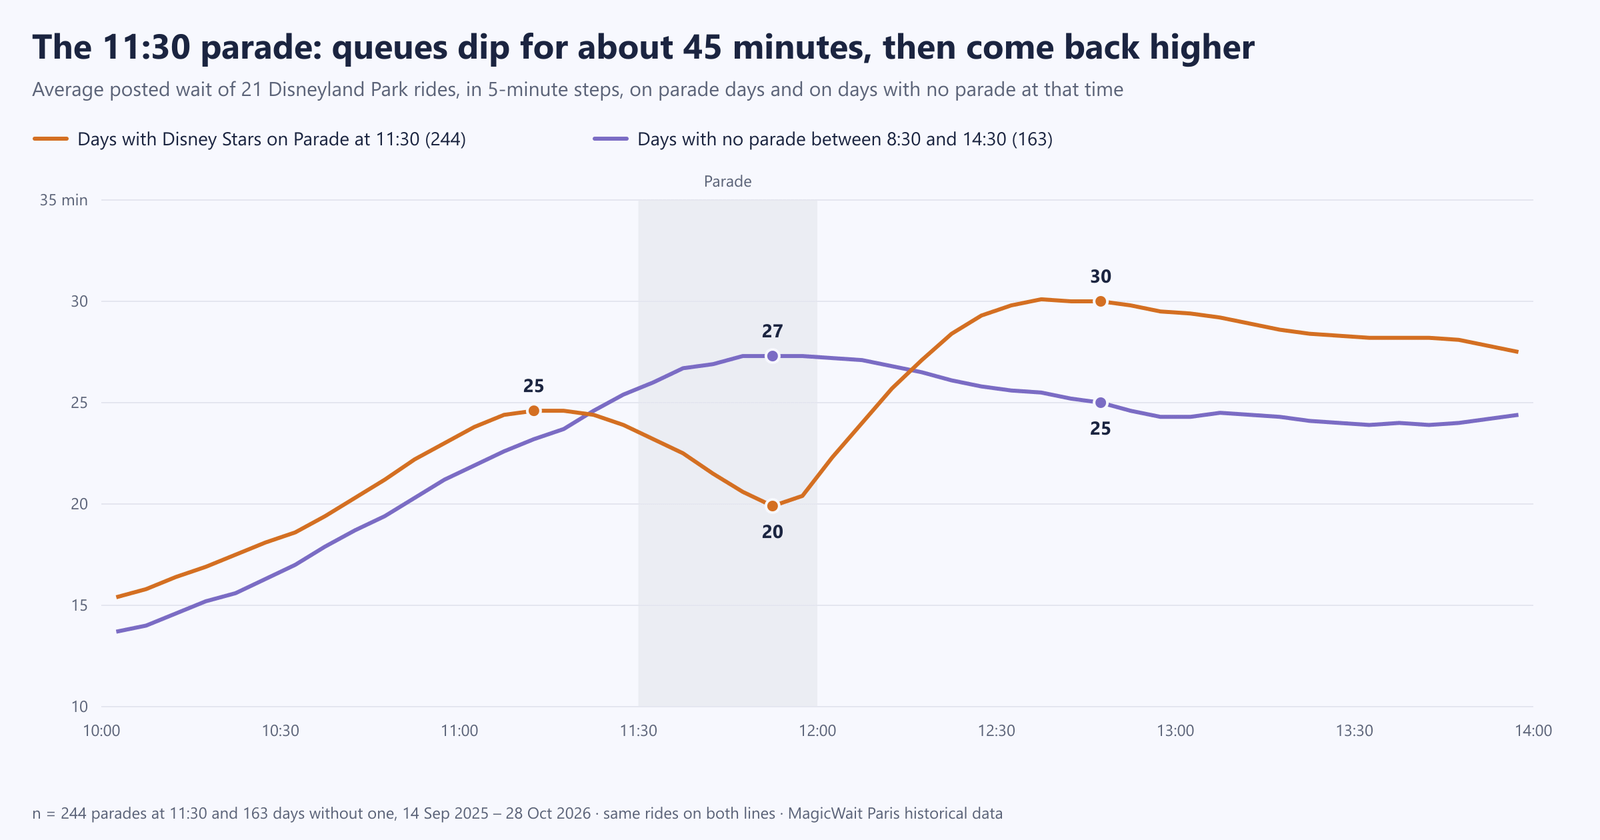
The window is also short, and you pay for it afterwards. With the 11:30 parade, the time slot for most of 2026, the drop starts a quarter of an hour before the parade sets off, bottoms out after 20 minutes and is over by minute 50. For the next hour and a half, queues sit about 3 minutes above normal: everyone comes back at once.
And it is not worth the same at every time. At 11:30, doing a ride during the parade saves you only a few minutes compared with the rest of the afternoon, and the best half hour of that afternoon nearly always beats it. With the late-afternoon parade (16:30 or 17:30), on the other hand, for most rides it beats even the best half hour of that afternoon: on Peter Pan, 85% of days.
We measured it with 1,150,160 wait-time readings from 21 attractions over 410 days, from September 14, 2025 to October 28, 2026.
The data: what we measured and how
- What we measure: the wait time Disney posts, recorded every five minutes, for the 21 Disneyland Park attractions we track. Breakdowns and closures are not counted.
- The parade schedule: since September 14, 2025 we have stored the time Disney publishes each day. That makes 349 Stars on Parade parades: 244 at 11:30, 74 at 17:30, 30 at 16:30 and one at 13:30.
- The comparison: the same time of day on days with no parade or cavalcade in the three hours before or the three hours after. We measure how much each queue changes from an hour and a half earlier in both groups; the difference is what the parade moves. That way we do not mistake the normal morning rise for the parade, or a busy day for a quiet one.
- Left out: the train. The Disneyland Railroad was closed during 70% of parades, against 6% at that same time on other days. Without it, Main Street U.S.A. has no attraction with a queue to measure.
- What we do not measure: the real queue, which does not always match the posted wait. Nor do we know which parades were cancelled: Disney publishes the planned time, not whether the parade actually went out.
Data updated as of October 28, 2026.
The parade changes time (and that is what lets us measure it)
| Period | Disney Stars on Parade time |
|---|---|
| September 14-29, 2025 | 17:30 |
| September 30 - November 2, 2025 | 11:30 (October 31: 13:30) |
| November 3-7, 2025 | 17:30 |
| November 8, 2025 - January 6, 2026 | No Stars on Parade: Christmas parade at 15:55 and 17:45 |
| January 7 - February 5, 2026 | 16:30 |
| February 6 - March 12, 2026 | 17:30 |
| March 13 - September 5, 2026 | 11:30 |
| September 6-24, 2026 | 17:30 |
| Since September 25, 2026 | 11:30 |
Schedule published by Disney for each day, from September 14, 2025 to October 28, 2026. Christmas parade times taken from its reserved viewing area. At Halloween there is also a cavalcade, Mickey’s Halloween Celebration, at 15:25 and 17:00.
There has not been a single day without a parade. But because Disney has moved it from 17:30 to 11:30 and back, we have 163 days with no parade at 11:30 and 175 with no parade at 17:30. They are our control group: same park, same time, no parade.
Ride by ride: how much it drops
| Attraction | Land | During the parade | Same time, no parade | Difference | Parades with a drop |
|---|---|---|---|---|---|
| Buzz Lightyear Laser Blast | Discoveryland | 33 min | 46 min | -13 min (-28%) | 94% |
| Orbitron | Discoveryland | 33 min | 45 min | -12 min (-26%) | 91% |
| Autopia | Discoveryland | 28 min | 39 min | -11 min (-28%) | 86% |
| Peter Pan’s Flight | Fantasyland | 53 min | 63 min | -10 min (-16%) | 88% |
| Blanche-Neige et les Sept Nains | Fantasyland | 14 min | 24 min | -10 min (-41%) | 91% |
| Dumbo the Flying Elephant | Fantasyland | 27 min | 36 min | -9 min (-26%) | 91% |
| It’s a small world | Fantasyland | 8 min | 17 min | -9 min (-53%) | 83% |
| Casey Jr. | Fantasyland | 13 min | 22 min | -9 min (-41%) | 84% |
| Les Voyages de Pinocchio | Fantasyland | 18 min | 27 min | -9 min (-34%) | 90% |
| Star Tours | Discoveryland | 11 min | 19 min | -8 min (-44%) | 80% |
| Pirates of the Caribbean | Adventureland | 16 min | 25 min | -8 min (-33%) | 82% |
| Big Thunder Mountain | Frontierland | 50 min | 58 min | -8 min (-14%) | 83% |
| Star Wars Hyperspace Mountain | Discoveryland | 28 min | 35 min | -7 min (-20%) | 85% |
| Indiana Jones and the Temple of Peril | Adventureland | 22 min | 29 min | -6 min (-22%) | 73% |
| Phantom Manor | Frontierland | 15 min | 20 min | -5 min (-25%) | 74% |
| Le Carrousel de Lancelot | Fantasyland | 9 min | 14 min | -5 min (-36%) | 82% |
| Le Pays des Contes de Fées | Fantasyland | 6 min | 11 min | -5 min (-47%) | 86% |
| Mad Hatter’s Tea Cups | Fantasyland | 7 min | 11 min | -4 min (-36%) | 78% |
“During the parade”: the 30 minutes after it sets off. “Same time, no parade”: what that attraction would have shown if its queue had moved as on control days. 349 Stars on Parade parades, between 211 and 348 per attraction depending on the days it operated. La Cabane des Robinson, Les Mystères du Nautilus and Alice’s Curious Labyrinth do not move: they show 5 minutes almost all the time.
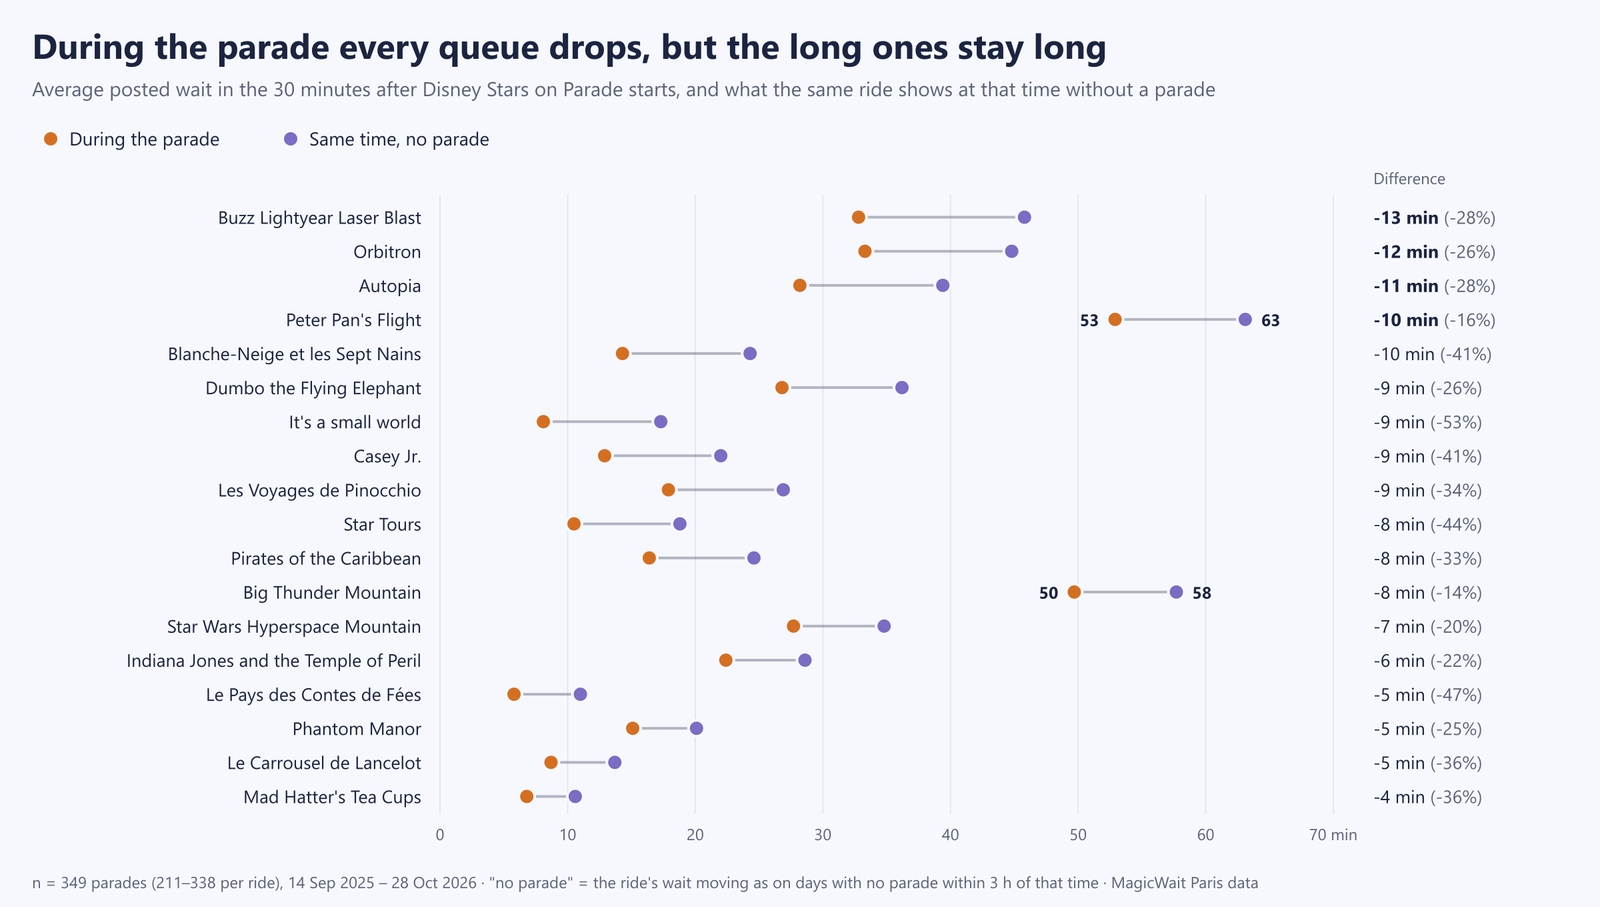
No attraction goes up during the parade. They all drop or stay the same, including the ones at the far end of the park.
In minutes, the biggest drop is Buzz Lightyear, followed by Orbitron and Autopia: all three in Discoveryland. In percentage terms, it is the small Fantasyland rides, which fall by half: It’s a small world goes from 17 to 8.
The two longest queues drop less than people say. Peter Pan’s Flight loses 16% and Big Thunder Mountain 14%: they are still at 53 and 50 minutes with the parade going by. In our Peter Pan analysis we counted 5 minutes because we compared it with the average before and after the parade; since the queue climbs above normal afterwards, that calculation fell short. Against the same time without a parade, it is 10. They are two different figures, but together they give you a more realistic idea of how the ride behaves during the parade.
| Land | During the parade | Same time, no parade | Difference | 60 to 90 min after |
|---|---|---|---|---|
| Discoveryland | 22 min | 31 min | -8 min (-27%) | +5 min |
| Fantasyland | 16 min | 23 min | -7 min (-31%) | +2 min |
| Frontierland | 32 min | 38 min | -6 min (-17%) | +1 min |
| Adventureland | 14 min | 19 min | -5 min (-25%) | +2 min |
| Whole park | 19 min | 26 min | -7 min (-27%) | +3 min |
Average of the attractions in each land. Last column: difference from normal at that time, 60 to 90 minutes after the parade sets off.
The land that drops most is not Fantasyland, where the parade starts: it is Discoveryland. It is also the one that bounces back most afterwards.
The result holds up to checks. If each parade is compared only with no-parade days less than four weeks away, so that seasons do not get mixed, the park drops by 6.6 minutes (149 parades). In 271 of the 349 parades, the park-wide drop was more than 5 minutes.
When it starts and when it ends
| Time relative to the parade start | 11:30 parade | 16:30 and 17:30 parades |
|---|---|---|
| 30 min before | 0 min | -1 min |
| 15 min before | -1 min | -3 min |
| Start | -5 min | -6 min |
| 20 min after | -9 min | -7 min |
| 40 min after | -3 min | +1 min |
| 1 hour after | +2 min | +2 min |
| 1 hour 30 after | +3 min | +1 min |
| 2 hours after | +2 min | 0 min |
Difference between the park’s average wait and normal at that time, in 5-minute steps. 11:30 parade: 244 parades and 163 control days. 16:30 and 17:30: 104 parades and 175 to 176 control days.
The drop starts late. With the 11:30 parade, a quarter of an hour before the start the queue has barely moved. In the afternoon, people take their spots earlier and the drop begins half an hour before the start. Peter Pan does its own thing: with the afternoon parade it starts dropping almost an hour earlier, probably because of families looking for a spot along the Fantasyland stretch.
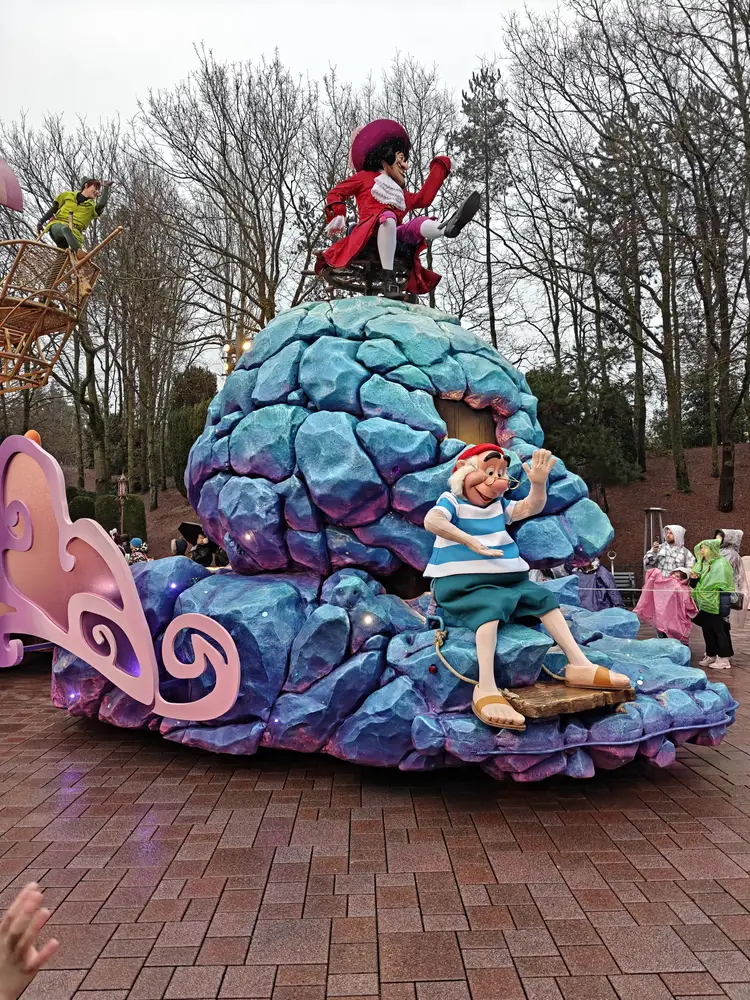
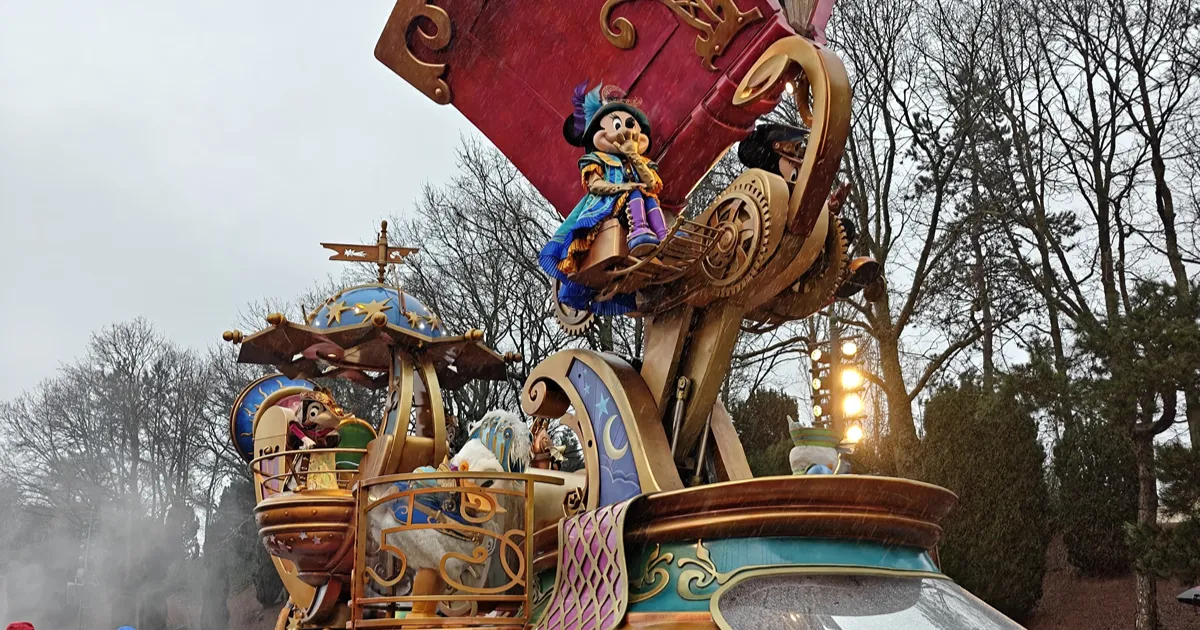
The Peter Pan float in Disney Stars on Parade on February 18, 2026, with the parade at 17:30.
The low point comes after 20 minutes. That is when the posted wait is lowest: 9 minutes below normal with the 11:30 parade.
After 40-50 minutes it is over. And with the 11:30 parade comes the rebound: between 12:30 and 13:30, queues sit about 3 minutes above normal, and up to 6.5 in Discoveryland. Everyone who was on Main Street goes back to the rides at the same time, right at lunchtime.
One detail that matters when reading the app: Disney does not update the posted wait at every reading. In Disneyland Park, half of the figures stay unchanged for 15 minutes or more. The real queue starts to drop a little earlier than the figure shows.
📱 The average covers 349 parades; yours is just one. If at 11:35 Buzz Lightyear is already showing 30 minutes and Peter Pan is still at 60, the decision is made before you move.
Is it worth it? It depends on the parade time
The practical question is not whether the queue drops, but whether it drops more than at any other time you could go. Compared with the rest of the afternoon on the same day:
| Attraction | 11:30 parade: vs. afternoon average | vs. best half hour of the afternoon | 16:30-17:30 parade: vs. afternoon average | vs. best half hour of the afternoon |
|---|---|---|---|---|
| Peter Pan’s Flight | -4 min | +6 min | -11 min | -4 min |
| Big Thunder Mountain | -3 min | +10 min | -11 min | -3 min |
| Buzz Lightyear Laser Blast | -7 min | +4 min | -14 min | -7 min |
| Star Wars Hyperspace Mountain | -4 min | +5 min | -12 min | -6 min |
| Orbitron | -2 min | +8 min | -14 min | -7 min |
| Autopia | -9 min | +2 min | -12 min | -4 min |
| Dumbo the Flying Elephant | -2 min | +8 min | -13 min | -7 min |
| Pirates of the Caribbean | -5 min | +8 min | -15 min | -8 min |
| Indiana Jones and the Temple of Peril | -2 min | +12 min | -13 min | -3 min |
| Les Voyages de Pinocchio | -6 min | +2 min | -11 min | -5 min |
Minutes more (+) or fewer (-) in the 30 minutes after the parade sets off, compared with the same attraction on the same day. “Afternoon”: 13:00 to 18:59, excluding the parade window (from one hour before to an hour and a half after). “Best half hour”: the lowest of that afternoon. 11:30 parade: between 192 and 236 days per attraction; 16:30-17:30, between 82 and 104.
With the 11:30 parade, the window is small. At that time queues are rising towards the day’s peak and the parade only slows them down. Doing Peter Pan during the parade saves you 4 minutes against the afternoon average, and the best half hour of that same afternoon beats it by 6. On Peter Pan, the parade beat the best half hour of the afternoon on 26% of days; on Indiana Jones, 9%.
With the afternoon parade, it is a real window. At 16:30 or 17:30, queues are already coming down and the parade pushes them further. Pirates of the Caribbean, Buzz Lightyear and Orbitron save 14-15 minutes against the afternoon average, and the parade beats the best half hour of that afternoon on 8 or 9 days out of 10.
What if you want to chain two or three? The useful window lasts between 45 minutes and an hour. With the afternoon parade, Buzz Lightyear and Orbitron save 28 minutes between them, with 46 minutes of combined wait; Dumbo and Blanche-Neige, 24 minutes with 28 of wait. With the 11:30 parade, the best Fantasyland pair (Pinocchio and Blanche-Neige) saves 11 minutes. We do not count ride duration or the walk between them.
The parade against the last hour of the day
For the attractions with the longest queues, the truly good window is not the parade, it is the end of the day:
| Attraction | During the parade | Last hour before closing | Last half hour | Days the parade beats the last hour |
|---|---|---|---|---|
| Peter Pan’s Flight | 57 min | 25 min | 13 min | 1% |
| Big Thunder Mountain | 54 min | 29 min | 23 min | 4% |
| Buzz Lightyear Laser Blast | 35 min | 15 min | 10 min | 2% |
| Star Wars Hyperspace Mountain | 30 min | 11 min | 9 min | 3% |
| Indiana Jones and the Temple of Peril | 24 min | 6 min | 5 min | 4% |
| Pirates of the Caribbean | 19 min | 7 min | 6 min | 7% |
| Orbitron | 39 min | 26 min | 23 min | 13% |
| Autopia | 31 min | 34 min | 26 min | 59% |
Same days: Stars on Parade days since April 5, 2026, when Peter Pan began operating until park closing (between 180 and 200 days per attraction). Closing time from the official schedule.
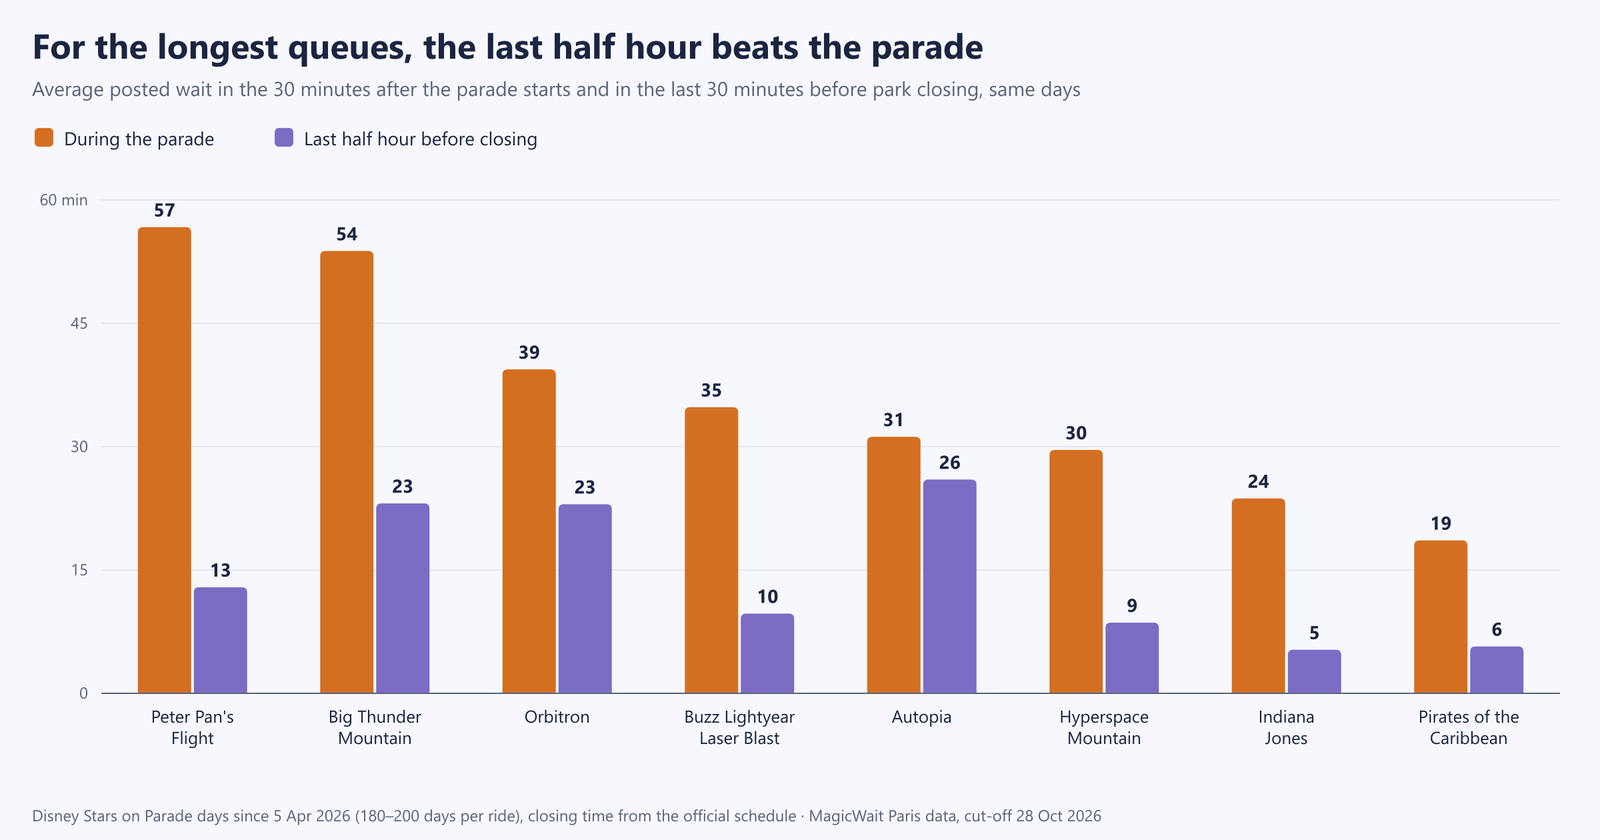
Since April, Peter Pan shows 57 minutes during the parade and 13 in the half hour before closing. If you can only save one window for it, it is not the parade. The same goes for Big Thunder, Buzz or Hyperspace. The exception is Autopia, which stays long until the end: there, the parade wins on more than half of days.
Watch out for Fantasyland: almost all its attractions, except Peter Pan and It’s a small world, have no readings in the last half hour; they close before the park does. Dumbo, Pinocchio and the carousel have no last-hour window: for them, the comparison that counts is the one in the previous section.
What about the castle show?
The question looks the same, but the data does not give the same answer. Disney Tales of Magic started at closing time, or ten minutes after, on 376 of the 409 days in the series. When it starts, the queues are already closed: there is no “during”.
What there is, is the last half hour. On those days, the park’s average wait drops from 17 minutes two hours before the show to 10 in the half hour before it. You cannot separate how much is people leaving to watch the show and how much is closing time, but the result for you is the same: for Peter Pan, Big Thunder, Buzz or Hyperspace it is one of the quietest half hours of the day.
On the 18 days when the park stayed open after the show, queues did not go back up: they kept falling. Everything suggests that after the show people do not go back to the rides: they leave.
When you notice it most (and least)
| Situation | Parades | Drop during the parade | Rebound an hour later |
|---|---|---|---|
| Quiet day (third with the shortest queues) | 109 | -6.5 min (-30%) | +1.2 min |
| Average day | 127 | -7.6 min (-28%) | +2.0 min |
| Busy day (third with the longest queues) | 113 | -6.9 min (-23%) | +4.4 min |
| Weekday / weekend (outside French school holidays) | 149 / 49 | -6.8 / -7.6 min | +3.2 / +2.2 min |
| Stars on Parade in regular season | 280 | -6.9 min (-27%) | +2.4 min |
| Stars on Parade at Halloween | 69 | -7.4 min (-27%) | +3.1 min |
| Christmas parade (2025) | 59 | -4.9 min (-20%) | 0 min |
| Halloween cavalcade | 68 | -4.3 min (-16%) | 0 min |
| Parade with rain (0.5 mm or more around the start) | 17 | -5.0 min | — |
Crowd level: the park’s average wait from 10:00 to 18:59 that day, in three equal groups. Christmas parade and Halloween cavalcade: only the first one each day. Rain: from half an hour before to half an hour after the start, compared with no-parade days that also had rain at that time.
The effect is almost the same every day: between 6.5 and 7.8 minutes, whether it is busy or quiet, a weekday or a weekend. By month, between 5 and 8 minutes. What changes is the rebound: on busy days, the hour after the parade sits 4 minutes above normal.
The special parades move queues less. The Christmas parade and the Halloween cavalcade bring queues down by about 4-5 minutes, against 7 for Stars on Parade. With rain, the drop stays at 5 minutes. Our data does not say which parades were cancelled, but it fits with some of those 17 not going out.
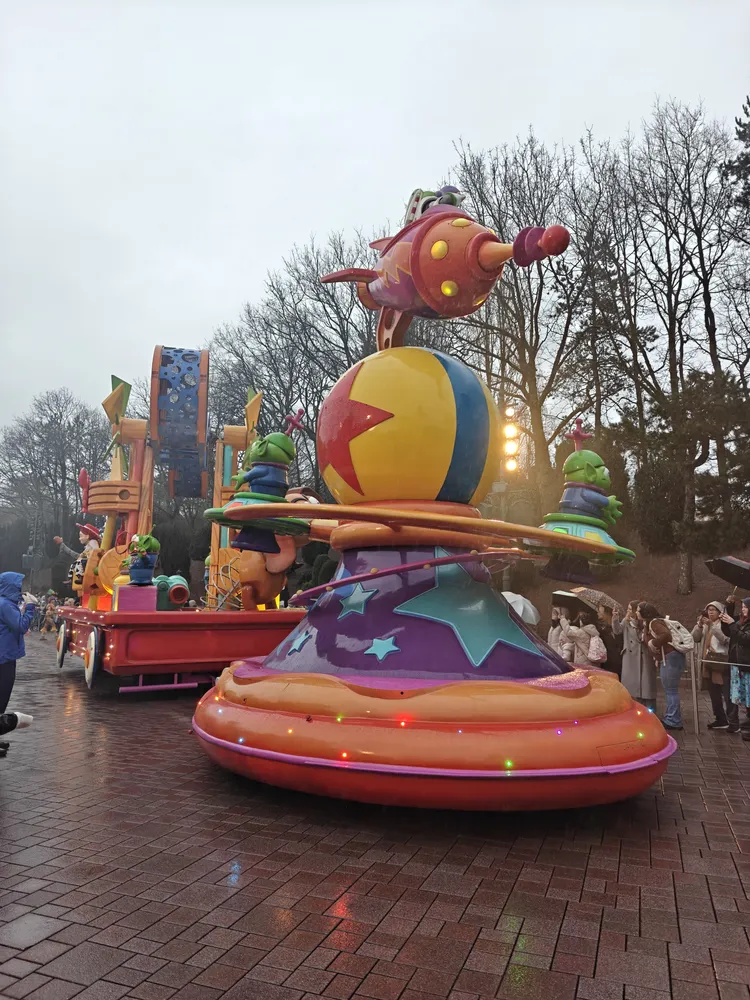
Disney Stars on Parade in the rain on February 18, 2026. That day the parade went out and park queues dropped 9 minutes below normal for that time.
What this means for your day
Take a group with one day in Disneyland Park that has already seen the parade, or prefers rides to floats, and is wondering whether to make use of it:
- First, check the parade time in MagicWait Paris on the day. Disney has moved it several times in a year, between 11:30 and 17:30, and what works for one time does not work for the other.
- 11:30 parade: one ride, not a plan. Join the queue between 11:35 and 11:55, when the posted wait is lowest. Pick one in the land you are in: in Discoveryland, Buzz Lightyear or Autopia; in Fantasyland, Pinocchio or Blanche-Neige. And use the following hour for lunch: that is when everyone comes back.
- 16:30 or 17:30 parade: two rides in the same land. It is the best half hour of the afternoon for almost all of them. Buzz Lightyear and Orbitron, or Dumbo and Blanche-Neige.
- Peter Pan and Big Thunder: do not save them for the parade. It takes 10 and 8 minutes off and they stay at 53 and 50. Their window is the last half hour before closing: 13 and 23 minutes on average.
- If you want to see the parade, see it. You give up about 7 minutes of advantage per ride, not an hour. And if you are taking a spot in Fantasyland for the afternoon parade, do Peter Pan beforehand: it starts dropping almost an hour earlier.
A Note from Verónica:
My own experience backs up the data in this article 100%. It is curious, because there are always lots of people watching the parades, but in the ride queues you hardly notice it. It is true, as we said, that Disney updates the wait times shown in the app every so often, and there can be moments when it shows a bit less. It is a matter of keeping an eye on it and hurrying to a ride.
We have used the parade to do the Discoveryland attractions, and it is true that we were lucky and Buzz Lightyear was at 15 minutes, which is a very good wait, but I will also tell you that behind us the queue started to fill up and the wait to go up.
So if you want to use the parade to do a ride, head to Discoveryland, but do not get obsessed with it, because overall it is not the best time either.
Summary: what each decision weighs
| Decision | Difference in average wait |
|---|---|
| Peter Pan: last half hour before closing vs. during the parade (since April 5) | 44 min |
| Pirates, Buzz or Orbitron during the afternoon parade, vs. that afternoon’s average | 14-15 min |
| Buzz Lightyear during the parade, vs. the same time without a parade | 13 min |
| Peter Pan during the parade, vs. the same time without a parade | 10 min |
| Any attraction during the parade, vs. the same time without a parade (park average) | 7 min |
| Peter Pan during the 11:30 parade, vs. that afternoon’s average | 4 min |
| The hour after the parade on a busy day, vs. normal | 4 min more |
MagicWait Paris own data, from September 14, 2025 to October 28, 2026.
The decision
The parade really does bring queues down: 7 minutes on average, in 344 of 349 parades. But it does not empty them, it lasts about 45 minutes and you pay for it afterwards. If the parade is at 11:30, use it for one nearby ride and the following hour for lunch. If it is at 16:30 or 17:30, chain two rides in the same land: it is the best half hour of the afternoon. And for Peter Pan and Big Thunder, forget the parade: their window is the last half hour of the day.
Have fixed dates and want to know when the parade falls and what to do in the meantime? Write to us at hello@magicwaitparis.com and we will look into it. And to see the queues live while the floats go by, MagicWait Paris.