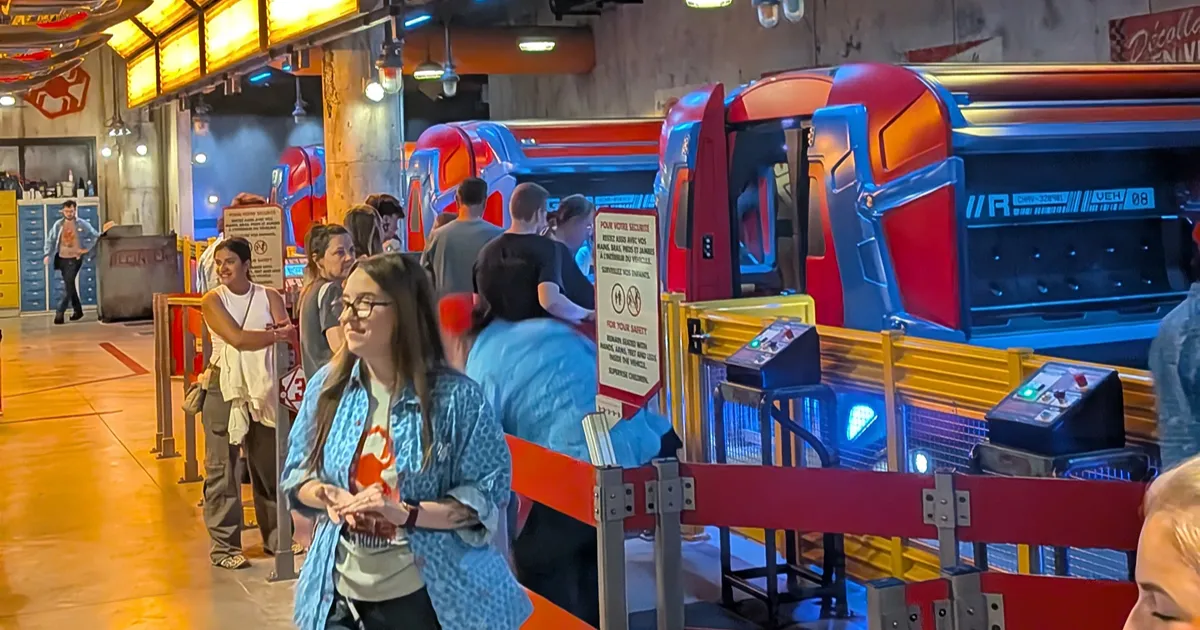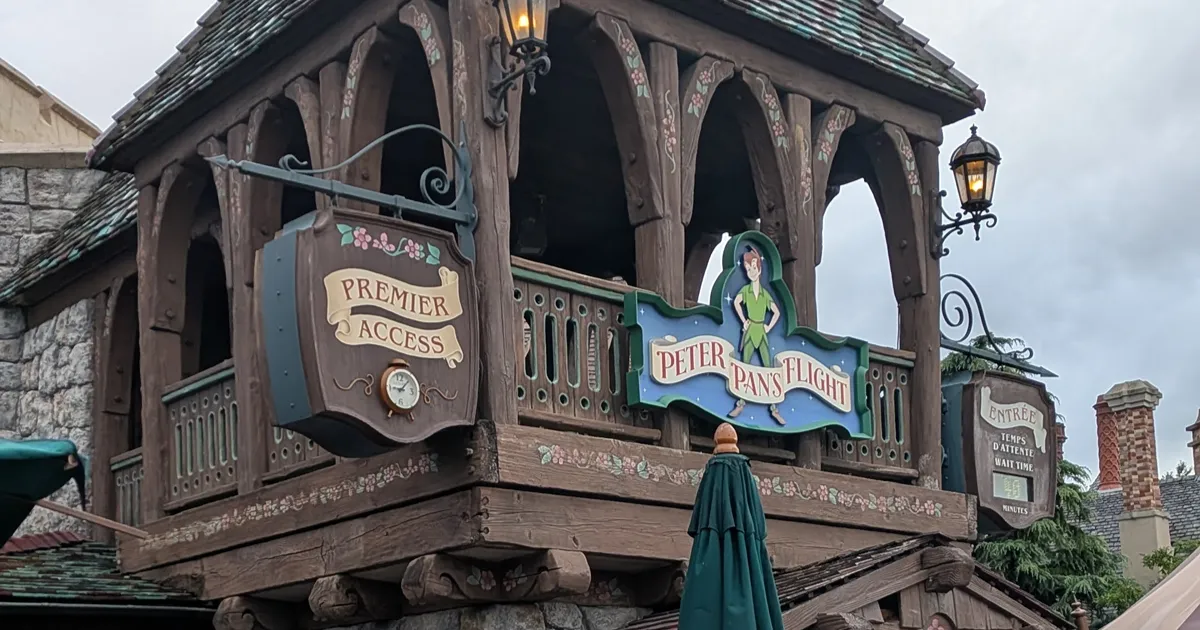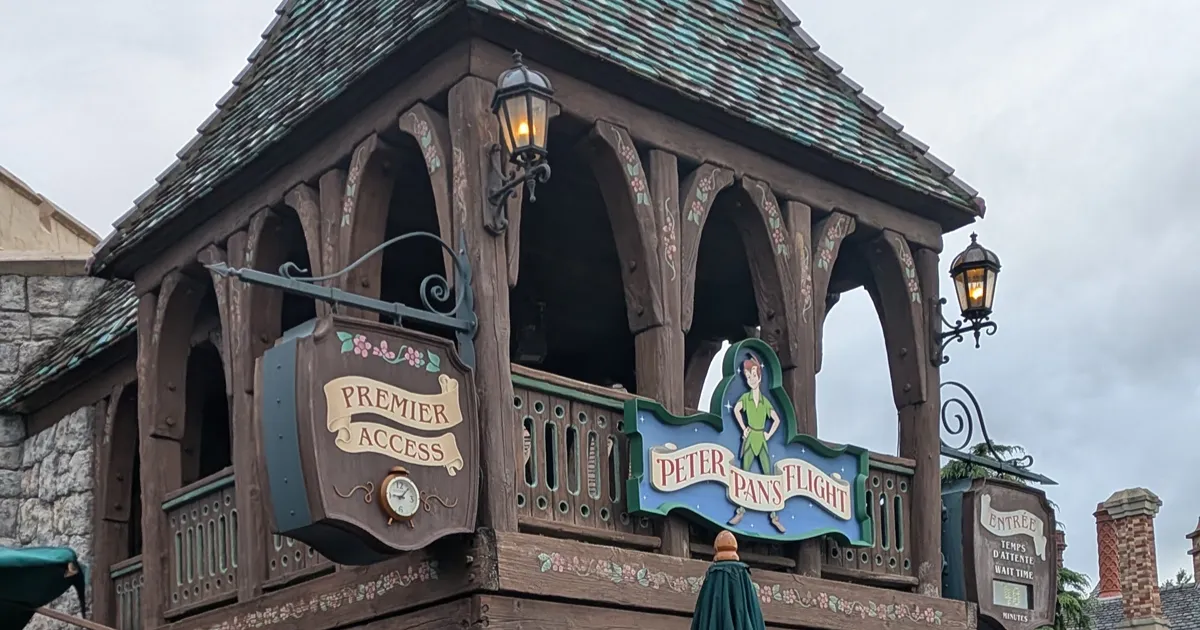
Since World of Frozen opened, Peter Pan’s Flight has not had a single half hour below 46 minutes of average wait between 9:30 and 21:00. Out of every 1,000 readings in that window, 3 have been under 30 minutes. The peak, at 12:30, is 67. It is the attraction with the longest wait in Disneyland Park on 81% of days.
For two years, on top of that, it had no good time in the evening either: it stopped running an hour before the park closed, and its last half hour was still at 34 minutes. Since April 5, 2026 it runs until closing time. And there, in the half hour before closing, it shows 13 minutes on average: 54 fewer than at 12:30 the same day.
We measured it with 135,701 wait readings over 910 days, from January 1, 2024 to October 22, 2026. It is the third attraction in the series, after Big Thunder Mountain and Spider-Man W.E.B. Adventure, with the same question: does it have a good time, or is it the Big Thunder of Fantasyland?
The data: what we measured and what we did not
- What we measure: the wait Disney posts, recorded every five minutes while the attraction is open. Breakdowns and closures do not count.
- Two periods: the full series (2024-2026) and, for the day’s curve, from March 29, 2026, when Disney Adventure World opened with World of Frozen. It is the period of our Premier Access analysis and the one that best describes what you will find now.
- The extra cost: the attraction’s average wait minus the median of all the attractions in its park at the same time. It is what you pay on top for choosing it. For Peter Pan and Big Thunder, the 23 Disneyland Park attractions we track.
- What we do not measure: the real queue, which does not always match the posted wait, or the Premier Access line.
Data updated as of October 22, 2026.
The day’s curve, half hour by half hour
| Time slot | Average wait since March 29, 2026 | 8 in 10 readings | Full series 2024-2026 |
|---|---|---|---|
| 8:30 (early access) | 24 min | 5–40 min | 20 min |
| 9:00 (early access) | 44 min | 35–55 min | 40 min |
| 9:30 | 52 min | 40–65 min | 43 min |
| 10:00 | 54 min | 45–65 min | 45 min |
| 10:30 | 58 min | 45–70 min | 51 min |
| 11:00 | 61 min | 50–75 min | 55 min |
| 11:30 | 57 min | 45–70 min | 54 min |
| 12:00 | 63 min | 50–75 min | 58 min |
| 12:30 | 67 min | 55–80 min | 60 min |
| 13:00 | 66 min | 50–80 min | 60 min |
| 13:30 | 64 min | 50–75 min | 58 min |
| 14:00 | 62 min | 50–75 min | 57 min |
| 14:30 | 61 min | 50–70 min | 57 min |
| 15:00 | 62 min | 50–75 min | 56 min |
| 15:30 | 60 min | 50–75 min | 55 min |
| 16:00 | 60 min | 50–70 min | 53 min |
| 16:30 | 59 min | 50–70 min | 53 min |
| 17:00 | 59 min | 46–70 min | 51 min |
| 17:30 | 58 min | 45–70 min | 49 min |
| 18:00 | 57 min | 45–70 min | 53 min |
| 18:30 | 57 min | 45–70 min | 51 min |
| 19:00 | 54 min | 40–70 min | 47 min |
| 19:30 | 51 min | 40–60 min | 43 min |
| 20:00 | 49 min | 40–60 min | 44 min |
| 20:30 | 46 min | 35–60 min | 40 min |
| 21:00 | 42 min | 30–55 min | 38 min |
| 21:30 | 31 min | 5–45 min | 30 min |
| 22:00 (late closing) | 19 min | 5–35 min | 18 min |
| 22:30 (late closing) | 6 min | 5–10 min | 9 min |
Posted wait by half-hour slot. Since March 29, 2026: n = 30,676 readings between 8:30 and 22:30, over 189 days. Full series: 135,701 readings over 910 days, from January 1, 2024 to October 22, 2026. The 8:30 and 9:00 slots are Disney hotel early access. The 22:00 and 22:30 slots only exist on days when the park closes late (164 and 116 days since March 29).
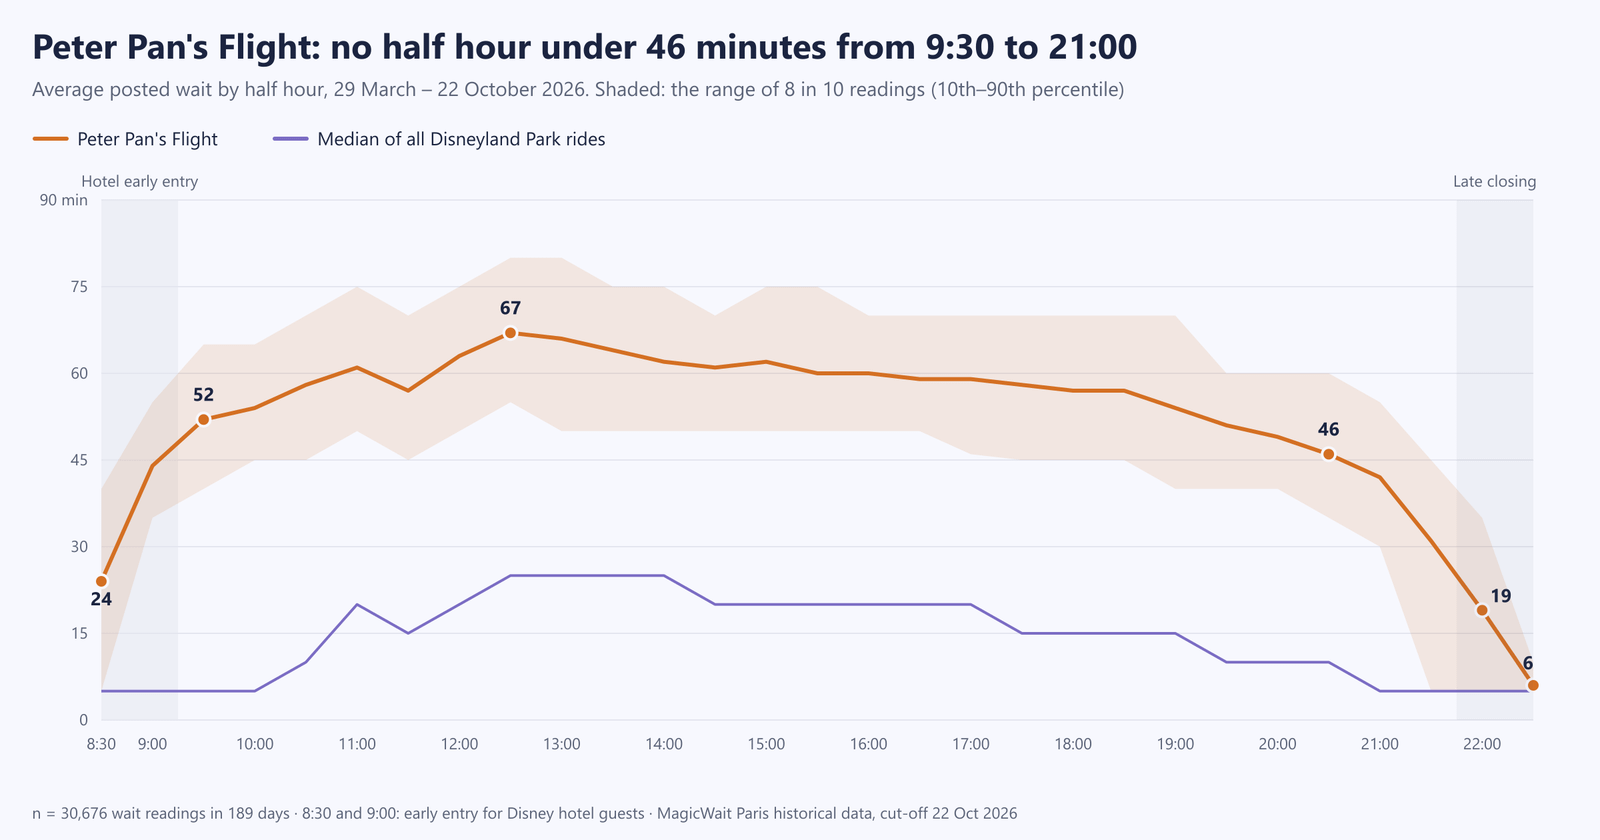
There is no gap during the day. Between 9:30 and 21:00, 93% of readings are at 45 minutes or more, and half (53%) at an hour or more. Under 30, 0.3%. Lunchtime changes nothing: 66 minutes at 13:00, 62 at 14:00. At Spider-Man, by 20:30 the queue is already down to 17. At Peter Pan, at that time it is still at 46.
2026 runs above the series. In every slot of regular opening hours, the wait since March 29 is 3-9 minutes above the 2024-2026 average. The jump came from 2024 to 2025, not with World of Frozen: we look at it further down.
The drop comes late and all at once. From 21:00 to 22:30, the average goes from 42 to 6 minutes. It does not depend on the time of day but on closing time. And that is what changed in April.
Is it the Big Thunder of Fantasyland? Yes, and a bit worse
| Attraction | Average extra cost from 10:00 to 18:00, since March 29, 2026 | Range by slot | Full series |
|---|---|---|---|
| Peter Pan’s Flight | +42 min (3.7 times the park median) | +37 to +49 | +36 min |
| Big Thunder Mountain | +38 min (3.4 times) | +34 to +44 | +36 min |
| Spider-Man W.E.B. Adventure | +13 min (1.4 times) | +10 to +16 | +16 min |
Average wait minus the median of its park, across the 17 half-hour slots between 10:00 and 18:00. Big Thunder has no data for 2024 and was under refurbishment until June 21, 2025: its full series starts there.
In the Big Thunder article we measured an extra cost of 36 minutes, flat all day. Recalculated with the same rule for all three attractions, Big Thunder comes out at 36 again over its full series. Peter Pan, also at 36. Since World of Frozen opened, it rises to 42 and overtakes Big Thunder (38).
And it is just as flat: between 10:00 and 18:00, it never drops below 37 minutes or goes above 49. When Peter Pan’s queue goes down in the afternoon, the rest of the park’s goes down at the same time. Spider-Man costs a third of that.
The shape of the day confirms it. If we divide each half hour by that day’s average wait between 10:00 and 18:00, the Peter Pan and Big Thunder curves are on average 4 percentage points apart per slot; Spider-Man’s, 13. These are the 367 days on which all three ran the full day. At 20:30, Peter Pan is still at 72% of its daily average and Big Thunder at 68%. Spider-Man, at 41%.
On the average wait from 10:00 to 19:00, Peter Pan had the longest wait in Disneyland Park on 735 of 902 days (81%), and was in the top three on 901. In 2026, Big Thunder has taken first place from it on 87 days.
Since April 5, the good time is the last one
Until April 4, 2026, Peter Pan’s Flight stopped running an hour before the park closed, in every month we have, from January 2024 to March 2026. With the park closing at 22:00, its last reading was at 21:00. It’s a small world did the same. Since April 5, both run until closing time. Disney did not announce it; our data shows it from one day to the next.
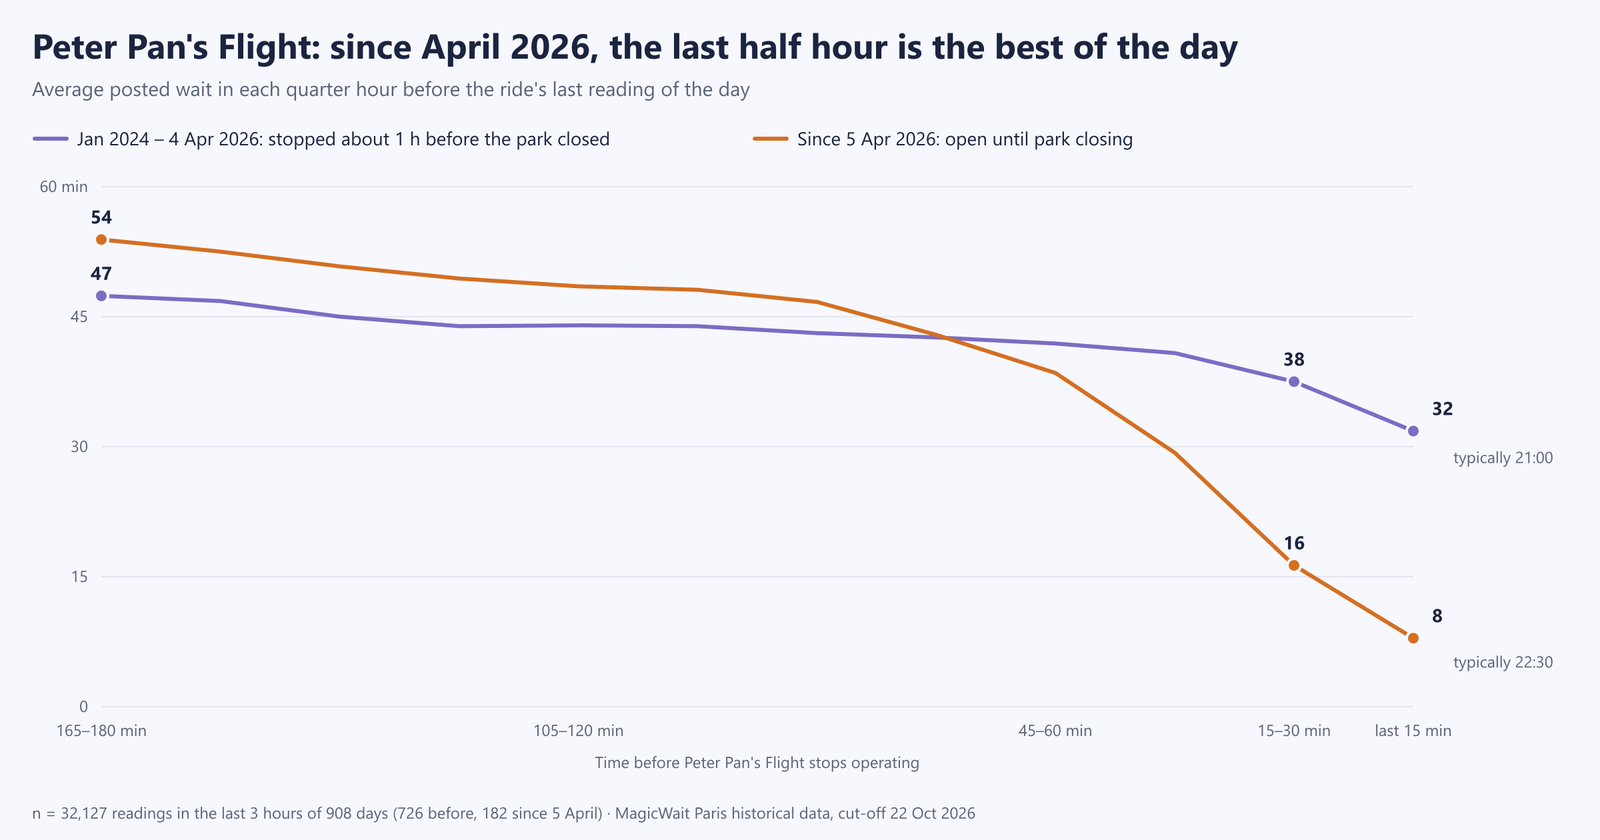
| Until April 4, 2026 | Since April 5, 2026 | |
|---|---|---|
| Last reading of the day (typical time) | 21:00, an hour before the park | 22:40, at closing time |
| Average wait in its last half hour | 34 min | 12 min |
| Days on which that half hour was under 30 minutes | 26% | 95% |
| Days on which it was under 20 minutes | 6% | 91% |
| Saving compared with 12:30 the same day | 23 min | 55 min |
Last half hour before the last reading with the attraction open, on days when it ran until 18:30 or later: 726 days before the change and 182 after.
Before, Peter Pan’s last half hour fell with the park still open for another full hour. Now it coincides with the end of the day: the median for the rest of the park is already at 5 minutes, and Disney Tales of Magic, the nighttime show, has started these months at closing time or ten minutes later.
Counted from the official closing time:
| Before park closing | Average wait | Readings under 30 min |
|---|---|---|
| 75 to 60 min | 43 min | 2% |
| 60 to 45 min | 39 min | 7% |
| 45 to 30 min | 31 min | 31% |
| 30 to 15 min | 18 min | 86% |
| Last 15 min | 8 min | 99% |
Since April 5, 2026, using the park’s official hours; between 171 and 180 days per slot. 124 days closing at 22:40, 48 at 22:00 and 9 at 21:00: the same thing happens with all three closing times.
The time to join the queue is between 30 and 15 minutes before closing. The average there is 18 minutes, and almost 9 in 10 readings are under 30. Pushing it to the last quarter hour brings the wait down to 8, but you are taking a bigger risk: on 5% of days, Peter Pan had no open reading at all in its last half hour, because of a stop or because it closed earlier.
What we do not know is whether the change will hold in winter. Since April there have only been 9 days closing at 21:00. If it goes back to closing an hour before the park, the window is gone.
📱 The average covers 182 evenings; yours is just one. If at 21:45 Peter Pan is already showing 15 minutes, there is no need to push it to the last quarter hour. And if it has stopped, better to know before crossing the park. In MagicWait Paris you see Peter Pan’s live wait and the rest of the park’s on the same screen. Access it for free!
Getting up early: the extra hour lasts a quarter of an hour, and opening time does not help
| Time of day, since April 5, 2026 | Average wait |
|---|---|
| First quarter hour of early access (8:30-8:45) | 13 min |
| First half hour of early access (8:30-9:00) | 23 min |
| First half hour after general opening (9:30-10:00) | 51 min |
| 12:30 | 67 min |
| 20:30 | 46 min |
| Last half hour before closing | 13 min |
Average for each moment over the 182 days since April 5, 2026, using each day’s official hours.
With Disney hotel early access, the first half hour saves you 44 minutes compared with 12:30 the same day. But, as we saw in the Extra Magic Time analysis, at Peter Pan the extra hour lasts fifteen minutes: at 8:30 it shows 5 and at 8:45, 26.
Without early access, arriving at opening time gets you nothing. On the 219 days with official hours since February 27, 2026, Peter Pan was already showing 30 minutes or more when the park opened every single day, and 45 or more on 80% of them. On the median day, it reaches an hour’s wait 38 minutes after opening. Since April 5, the last half hour has beaten the first half hour of the morning every day, by 38 minutes on average.
What does not move Peter Pan
| Comparison | Average wait from 10:00 to 19:00 | Days |
|---|---|---|
| Weekday / weekend | 54 / 55 min | 648 / 262 |
| Outside French school holidays / during them (excluding July and August) | 53 / 58 min | 504 / 222 |
| Dry day / rainy day (5 mm or more) | 54 / 53 min | 761 / 149 |
| Maximum below 25 °C / 30 °C or more | 53 / 56 min | 747 / 63 |
| 2024 / 2025 / 2026, same dates | 45 / 58 / 59 min | 239 each year |
Full series, from January 1, 2024 to October 22, 2026. Years: each day of 2026 up to October 22, compared with the same weekday in 2025 and in 2024, only when Peter Pan ran on all three.
Between a weekday and a weekend, one minute. French school holidays: about 5 minutes outside summer. Rain does not move it, for better or worse: the park’s outdoor attractions drop from 24 to 21 minutes, and Peter Pan, being indoors, stays where it is. Nor does heat, if you compare within the same month: in August, 57 minutes below 25 °C and 57 at 30 °C or more.
The year does. On the same dates, Peter Pan went from 45 minutes in 2024 to 58 in 2025, and to 59 in 2026. Since World of Frozen opened, 59 in 2025 and 60 in 2026: the new park has not emptied it, as we saw in our analysis of Frozen’s impact.
There are no quiet days. Out of 905 days with complete data, only 7 averaged under 30 minutes between 10:00 and 19:00, and all of them are from 2024: six between July 27 and August 1, as the Paris Olympic Games got under way, and January 17, with 29 mm of rain. In 2025 and 2026, not one. The lowest: January 22, 2025 (37 minutes) and March 29, 2026, the day World of Frozen opened (38). The median day of 2026 is at 59.
Princess Week does not make it spike. Compared with the 14 days before, in the middle of August, Peter Pan dropped 4% in 2024 and 7% in 2025, and rose 2% in 2026. It does drop less than the rest of the park, though, which fell 9%, 11% and 2%.
If it stops, stay close
Peter Pan stops far less than Big Thunder: a stop of 30 minutes or more on 16% of days, with a median duration of 20 minutes, as we covered in our breakdowns analysis. Three out of four stops are resolved within half an hour.
And when it reopens, the posted queue does not shoot up: it goes down. Across 349 stops of 15 minutes or more, it showed 56 minutes before stopping, 45 on reopening and 59 half an hour later, when the usual wait at that time is 55. If it stops nearby, wait and go in as soon as it reopens: about 10 minutes less than normal. If you come back an hour later, you will find it longer than before.
What about Premier Access?
Peter Pan has no Single Rider, so Premier Access is the only way to skip the queue. With a Premier Access line of 5 to 15 minutes, as in our Premier Access analysis:
| Time slot | Normal average wait | Minutes saved |
|---|---|---|
| 12:30 | 67 min | 52–62 min |
| 15:00 | 62 min | 47–57 min |
| 20:30 | 46 min | 31–41 min |
| Last half hour before closing | 13 min | almost nothing |
Since March 29, 2026; last half hour, since April 5.
If you are going to pay for it, make it midday; at 22:00 you would be paying to save 13 minutes. The price changes depending on the date: for 2026, from about €5 to a little over €20 per person per attraction with Premier Access One. Check the official app for your day.
What this means for your day
Peter Pan’s Flight has no minimum height and is one of the rides a family with young children wants to do no matter what. That is the trap: it is the attraction that most punishes improvising, and its two windows fall at 8:30 and in the half hour before closing, when young children have either not arrived yet or cannot take any more.
For a family with a single day in Disneyland Park:
- With a Disney hotel: Peter Pan goes first, at 8:30 sharp. By 8:45 it is no longer the same.
- Without a hotel and with children who can last until closing: Peter Pan goes last. Be in the queue between 30 and 15 minutes before closing time: 18 minutes on average.
- Without a hotel and with children who will not make it to the evening: assume an hour of queuing. Between 10:00 and 19:00 the average never drops below 54 minutes. Choose the time for comfort (shade, tiredness, food), not in the hope that it goes down. If the budget allows, this is where Premier Access pays off, at midday.
- What does not work: going first thing without early access (51 minutes on average in the first half hour) or waiting for the parade.
- If it stops while you are nearby: stay. On reopening it shows about 10 minutes less than usual.
- If you have two days: set aside one of the two evenings for Peter Pan and whatever you have nearby in Fantasyland.
A Note from Verónica:
This is perhaps one of the most controversial attractions when it comes to whether the wait is worth it. It is true that it is very pretty, but it is very short, and because it is dark it can even scare very young children. It depends on how long you are in the parks and how you organise yourselves, but if you want to ride it, I would leave it until the very end now that its hours have been extended. It is true that it is a shame to leave without riding it, since it is one of the signature rides of Disneyland Paris, but I also think that, now that the resort has been expanded, the attraction would need a refurbishment to bring it up to date.
I remember that on my first visit, back in 2000, it already had one of the longest queues (if not the longest), and in those days there were not as many wait-time displays, so you went from ride to ride by whatever was closest. It has changed very little since then.
Summary: what each decision weighs
| Decision | Difference in average wait |
|---|---|
| Last half hour before closing vs 12:30 (since April 5) | 54 min |
| Early access (8:30-9:00) vs 12:30 | 44 min |
| Last half hour vs first half hour after opening | 38 min |
| 20:30 vs 12:30 | 21 min |
| French school holidays vs the rest (excluding July and August) | 5 min |
| During the parade, vs the trend at that time | 5 min less |
| Weekend vs weekday | 1 min |
| Rain vs dry day | 1 min less |
MagicWait Paris’s own data, from January 1, 2024 to October 22, 2026.
The decision
Peter Pan’s Flight is the Big Thunder of Fantasyland: between 36 and 42 minutes more than the rest of the park at any time of day, with no gap at midday, no gap during the parade and no quiet days since 2025. And, since April 5, 2026, with the same single way out as Big Thunder: the end of the day, now with 13 minutes on average in the last half hour. If you have early access, Peter Pan at 8:30. If not, Peter Pan in the last half hour before closing. And if your day does not stretch into the evening, accept the hour of queuing or pay for Premier Access at midday. What does not work is waiting for it to go down.
Have fixed dates and want to know whether Peter Pan fits in at the end of the day with children? Write to us at hello@magicwaitparis.com and we will look into it. And for the live wait, MagicWait Paris.