
When it rains at Disneyland Paris, queues don’t go up. They go down, slightly, almost always, at almost every attraction, in almost every month of the year. That’s the result of crossing two years of daily rainfall records with our wait-time history: 730 days, of which 238 are classified as rainy and 492 as dry, broken down to the level of individual attractions.
Bear in mind this doesn’t mean it didn’t rain on the remaining 492 days: storms and showers are a constant on almost every day in the parks. It means days when the rain was steady and continuous.
There is one real exception in the whole analysis, and we cover it below exactly as the data shows it, without smoothing it over.
The Aggregate: 730 Days, Indoors and Out
| Day type | Location | Median (min) | Mean (min) | Days analyzed (n) |
|---|---|---|---|---|
| Rainy | Outdoors | 10 | 17 | 238 |
| Rainy | Indoors | 5 | 16 | 238 |
| Dry | Outdoors | 15 | 19 | 492 |
| Dry | Indoors | 5 | 15 | 492 |
MagicWait Paris data, calendar years 2024-2025 (730 days), cutoff 31/12/2025.
The statistical correlation between millimetres of rain and the day’s median wait is weak and, if anything, negative: -0.184 in 2024 and -0.102 in 2025 (730 days with data). More rain, if there is any effect at all, points toward less queue, not more.
Attraction by Attraction, Across Both Parks
This is what changed compared with the first version of this analysis: instead of stopping at the aggregate, we looked at 26 attractions at Disneyland Park and Disney Adventure World one by one, 13 outdoors and 13 indoors.
Outdoor Attractions
| Attraction | Park | Rainy median | Dry median | Worst rainy day | Worst dry day |
|---|---|---|---|---|---|
| Alice’s Curious Labyrinth | Disneyland Park | 5 | 5 | 10 | 10 |
| Autopia, presented by Avis | Disneyland Park | 30 | 30 | 50 | 90 |
| Big Thunder Mountain | Disneyland Park | 45 | 45 | 60 | 75 |
| Casey Jr. – le Petit Train du Cirque | Disneyland Park | 10 | 15 | 25 | 35 |
| Dumbo the Flying Elephant | Disneyland Park | 25 | 30 | 50 | 50 |
| Indiana Jones and the Temple of Peril | Disneyland Park | 15 | 20 | 50 | 50 |
| Mad Hatter’s Tea Cups | Disneyland Park | 5 | 5 | 15 | 15 |
| Orbitron | Disneyland Park | 25 | 35 | 60 | 58 |
| Cars Quatre Roues Rallye | Disney Adventure World | 5 | 10 | 25 | 25 |
| Les Tapis Volants | Disney Adventure World | 5 | 10 | 25 | 30 |
| RC Racer | Disney Adventure World | 30 | 35 | 50 | 50 |
| Slinky Dog Zigzag Spin | Disney Adventure World | 5 | 5 | 20 | 20 |
| Toy Soldiers Parachute Drop | Disney Adventure World | 35 | 35 | 50 | 50 |
MagicWait Paris data, 2024-2025, n between 68 and 599 days depending on the attraction, cutoff 31/12/2025.
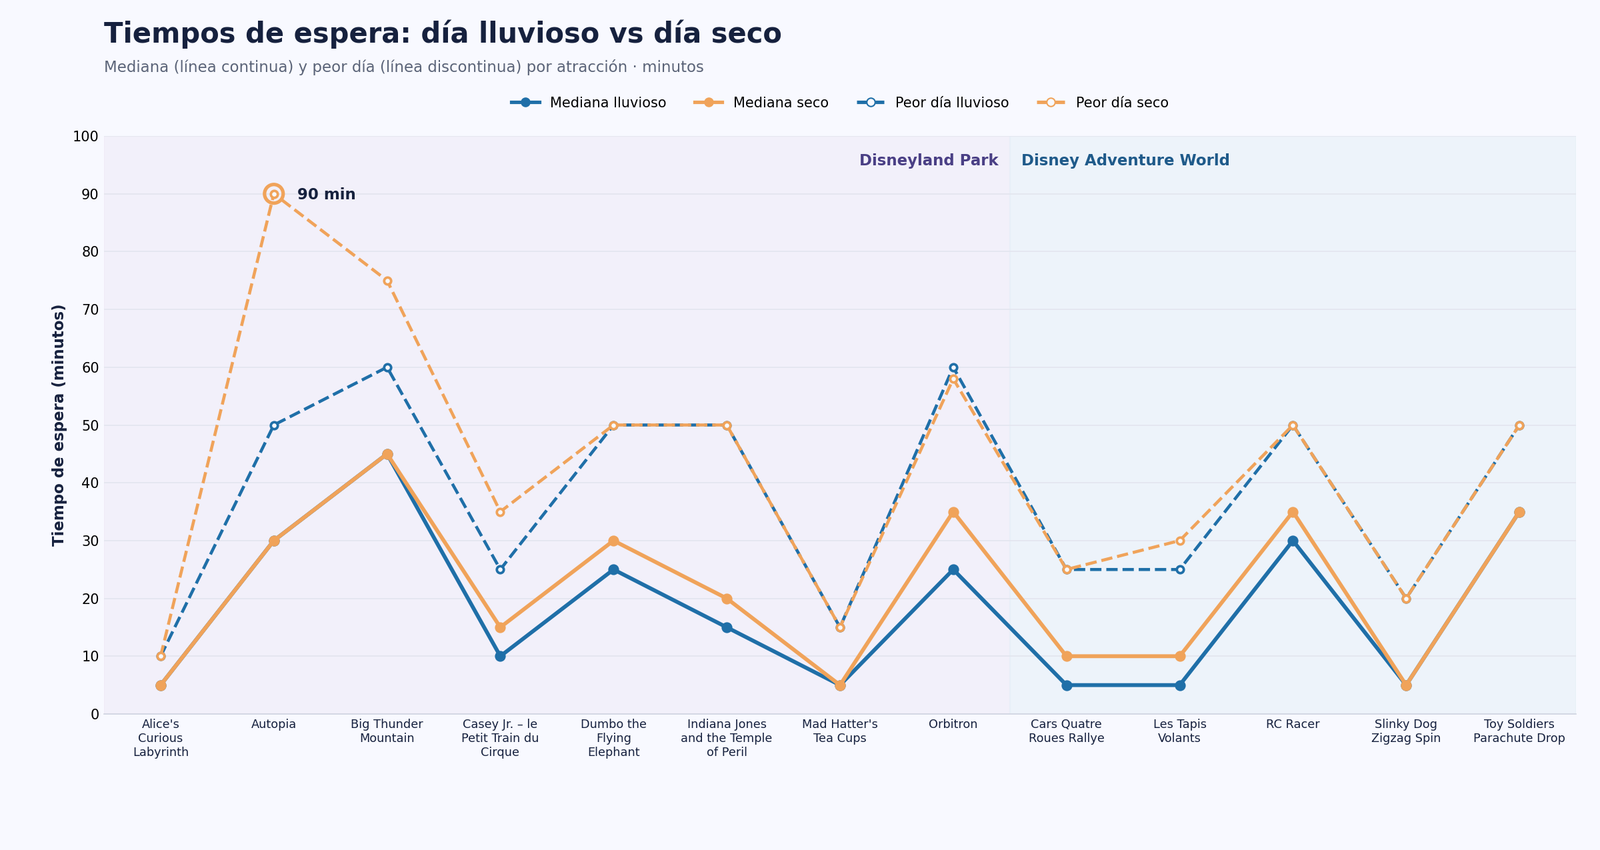
The pattern repeats attraction after attraction: the median on rainy days is equal to or lower than on dry days in 14 of the 15 attractions analyzed in detail. It’s true that the worst rainy day drops a few minutes at Big Thunder Mountain and Casey Jr. – le Petit Train du Cirque, but it’s not dramatic.
The one that moves the most is Autopia. It makes sense once you think about it: it’s a long ride, you’re seated and the car doesn’t go fast, so if it rains you get properly wet, not just a little. Its worst recorded peak falls from 90 minutes on a dry day to 50 in the rain, the biggest drop in the whole table, because a large share of visitors prefer not to sit soaked through several minutes of open-air track. And, just as with heat waves, it’s not unusual for Autopia to close outright during the heaviest rain, which also trims those queue peaks.
Indoor Attractions
| Attraction | Park | Rainy median | Dry median | Worst rainy day | Worst dry day |
|---|---|---|---|---|---|
| Avengers Assemble: Flight Force | Disney Adventure World | 15 | 15 | 40 | 45 |
| Blanche-Neige et les Sept Nains | Disneyland Park | 20 | 20 | 35 | 35 |
| Buzz Lightyear Laser Blast | Disneyland Park | 25 | 25 | 60 | 65 |
| Crush’s Coaster | Disney Adventure World | 70 | 65 | 90 | 110 |
| It’s a small world | Disneyland Park | 5 | 5 | 25 | 40 |
| Les Voyages de Pinocchio | Disneyland Park | 25 | 25 | 35 | 35 |
| Peter Pan’s Flight | Disneyland Park | 45 | 50 | 75 | 90 |
| Phantom Manor | Disneyland Park | 5 | 10 | 40 | 40 |
| Pirates of the Caribbean | Disneyland Park | 15 | 15 | 40 | 45 |
| Ratatouille: L’Aventure Totalement Toquée de Rémy | Disney Adventure World | 35 | 35 | 55 | 60 |
| Spider-Man W.E.B. Adventure | Disney Adventure World | 40 | 40 | 65 | 70 |
| Star Wars Hyperspace Mountain | Disneyland Park | 25 | 30 | 90 | 90 |
| The Twilight Zone Tower of Terror | Disney Adventure World | 30 | 26 | 60 | 70 |
MagicWait Paris data, 2024-2025, n between 50 and 602 days depending on the attraction, cutoff 31/12/2025.
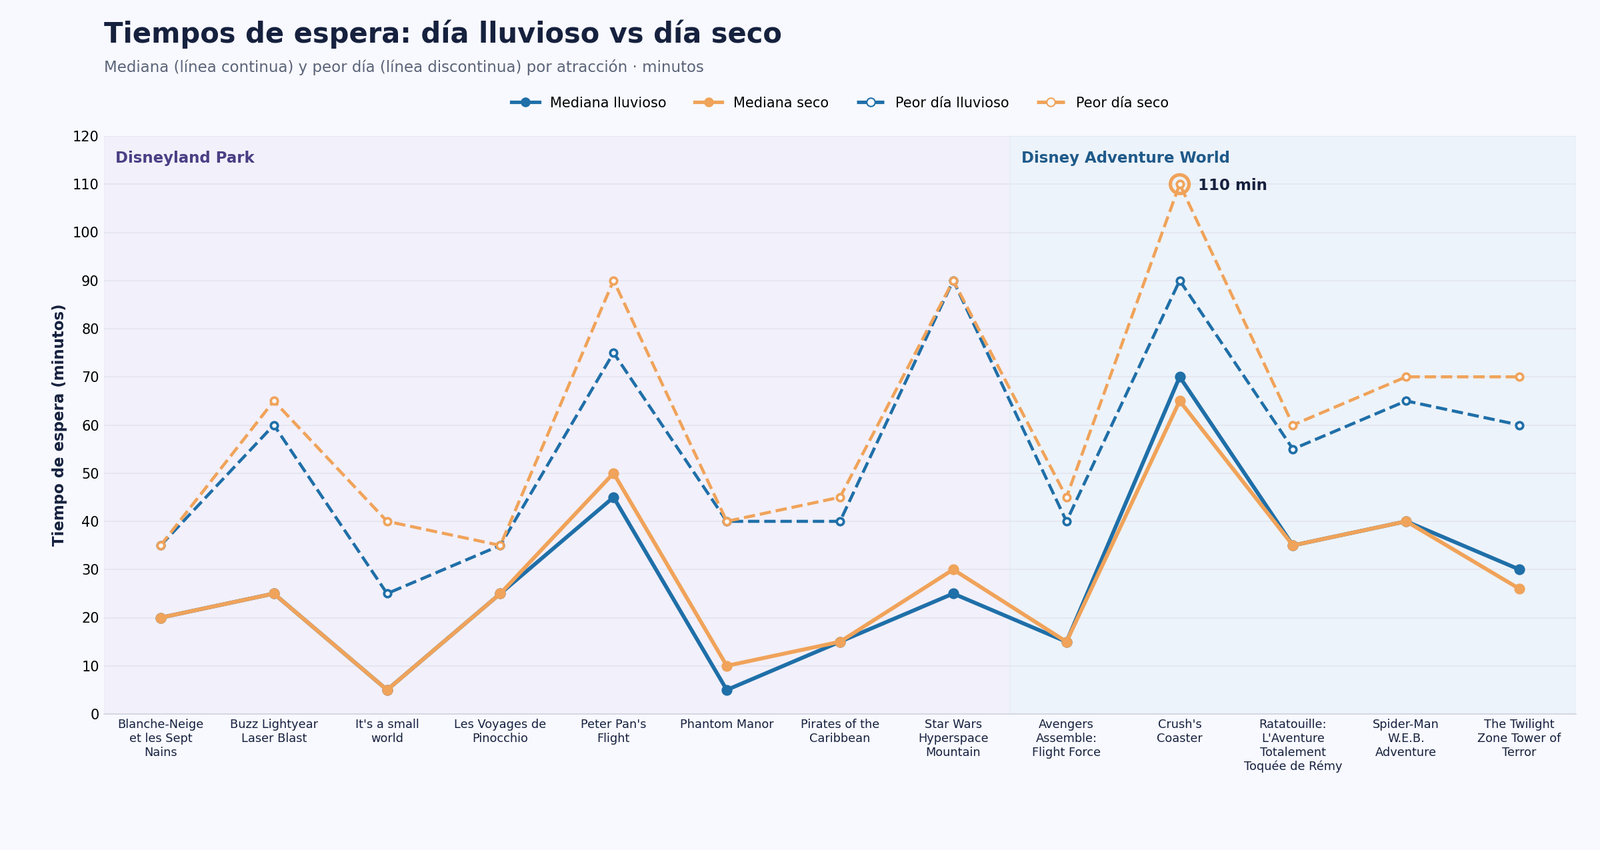
Indoors the general pattern holds: 11 of the 13 attractions have an equal or lower median in the rain, but here appear the only two exceptions in the whole analysis, and both are covered coasters at Disney Adventure World: Crush’s Coaster (70 min in rain vs. 65 dry) and The Twilight Zone Tower of Terror (30 vs. 26). It’s no coincidence that it’s exactly these two: they’re high-demand attractions that already run almost full most of the time. On a dry day that demand also spreads across the park’s outdoor attractions; on a rainy day, much of whoever stays in the park concentrates on the few covered attractions with the most “event” capacity, and these two are among the most sought after.
Although it might seem otherwise, there is generally no significant change at any indoor attraction: people spread out but no bottlenecks form.
Does How Much It Rains Matter?
With the intensity detail, the answer is no.
| Rain intensity | Average rainfall | Days (n) | Median (min) | Mean (min) |
|---|---|---|---|---|
| Very light (<2 mm) | 0.7 mm | 205 | 10 | 16 |
| Light (2-5 mm) | 3.4 mm | 97 | 5 | 16 |
| Moderate (5-10 mm) | 7.0 mm | 77 | 5 | 17 |
| Heavy (10-20 mm) | 13.2 mm | 37 | 5 | 16 |
| Very heavy (>20 mm) | 24.7 mm | 14 | 5 | 16 |
MagicWait Paris data, 2024-2025 (430 rainy days with recorded intensity).
It doesn’t matter whether it’s a drizzle under 2 mm or a downpour over 20: the median moves between 5 and 10 minutes and the mean barely leaves the 16-17 minute range in every band. The park doesn’t behave differently in the face of a heavy storm than it does with a few drops, at least not in the queue.
What If It Only Rains Part of the Day?
We specifically looked at afternoon waits depending on how the rain is spread across the day.
| Rain pattern | Afternoon median (min) | Afternoon mean (min) | Days (n) |
|---|---|---|---|
| Rain in the morning only | 5 | 16 | 26 |
| Rain in the afternoon only | 5 | 16 | 49 |
| Rain all day | 5 | 15 | 53 |
| Dry day | 10 | 16 | 492 |
MagicWait Paris data, 2024-2025, cutoff 31/12/2025.
The interesting figure here is that even on days when it only rained in the morning, the afternoon median stays at 5 minutes, the same as on days with rain all day, and half of a dry day’s. There’s no “recovery” of attendance in the afternoon once it clears up: whoever didn’t come in the morning doesn’t seem to show up in the afternoon in the same proportion as on a normal dry day.
Is It Like This All Year, or Only in Some Months?
| Year | Months with lower median in rain | Months with no difference | Months with higher median in rain |
|---|---|---|---|
| 2024 | 6 | 6 | 0 |
| 2025 | 4 | 8 | 0 |
Month-by-month comparison of the park’s overall median, rainy vs. dry, 24 months (2024-2025).
In no month of the two years analyzed does the park’s overall median rise on rainy days compared with dry days in the same month. In the worst case there’s no difference; in the rest, it drops 5 minutes. There is no season of the year in which this pattern reverses at park level.
What About the Truly Chaotic Days? They’re Almost Never Rainy Days
| Year | Rainy days among the 20 busiest days | Dry days among the 20 busiest days |
|---|---|---|
| 2024 | 2 | 18 |
| 2025 | 3 | 17 |
In two years, only 5 of the 40 most collapsed days at the park were rainy days. What really fills Disneyland Paris, school holidays, long weekends, peak season, weighs far more than the day’s weather forecast.
But the park doesn’t empty out because it rains either; there isn’t as much movement as we might think. Most attractions are adapted for rain and are indoors, so queues don’t vary much.
A Note from Verónica
Rain is something you have to learn to live with if you’re going to DLP, regardless of the time of year. It’s very likely that rain will accompany you at least at some point during the day, but that’s far from an obstacle to enjoying the park’s many possibilities. We’ve seen how the park behaves and that there are no significant changes: except for Autopia, wait times don’t drop and queues don’t empty out.
Let’s start from the fact that, if the rain is heavy, some outdoor attractions will be very uncomfortable, but that’s what Disney ponchos are for; no rain can resist one. 😉
My advice: Autopia, Le Pays des Contes de Fées, Dumbo… are very uncomfortable attractions to ride in the rain, especially because you normally ride them with small children. But then there are others that, unless it’s a torrential downpour, can be done with a good raincoat. We’ve seen that the park doesn’t vary much, so when making a plan you only need to consider whether you want to get more or less wet and spread those attractions out. Also, I repeat, as with heat waves, many attractions close, so you have to stay alert.
What to Do If Your Visit Coincides with Rain
- Don’t reorganize your whole day plan because of the forecast. The aggregate effect works in your favor: less queue outdoors, practically the same indoors.
- Don’t assume the covered attractions fill up. Of 15 attractions analyzed, only one (Tower of Terror) shows that pattern.
- Give extra margin to Tower of Terror and Crush’s Coaster if it rains and they’re on your plan; they’re the only ones that, with the data in hand, get worse with rain.
- Don’t count on Autopia in heavy rain: its queue drops a lot, but it’s one of the attractions most likely to close temporarily because of its own open-air track.
- Don’t change strategy based on the intensity of the downpour: very light or very heavy, the queue behaves practically the same.
- Check the live data if there’s a heavy storm, not for attendance but for possible temporary technical stops at outdoor attractions, as happens with Big Thunder Mountain or Autopia. With MagicWait Paris you can see if a queue has really spiked before you walk over, instead of trusting only the rain you see falling.
The Concrete Decision
If your visit falls on a day with rain forecast, don’t move it because of that, not even if the forecast announces heavy rain all day. Two years of history, 730 days and 26 attractions say that rain at Disneyland Paris tends to empty the park more than fill it, whatever the month or the intensity. A poncho and the day’s live data are all you need.
Do you have a specific date with rain in the forecast and want us to review which attractions you should prioritize that day? Write to us at MagicWait Paris or at hello@magicwaitparis.com.