
Six months after World of Frozen opened, Disneyland Park has not emptied. On normal days, without French school holidays or heat, its 21 attractions wait the same as in 2025: 1% more. What has changed is the other park. The long-standing attractions of Disney Adventure World wait 17% more than a year ago, and the ones with no minimum height, the ones a family with small children can ride, 26% more.
Cars ROAD TRIP has gone from 10 to 21 minutes on average in the middle hours of the day. Slinky Dog Zigzag Spin, from 12 to 18. Ratatouille, from 41 to 57. Meanwhile, in Fantasyland, Dumbo has dropped from 41 to 32.
Frozen has not spread people between the two parks. It has brought a specific audience, families with children, and that audience fills the family attractions around it.
We measured it with 1,076,109 wait-time records from 32 attractions, comparing each day between March 29 and September 29, 2026 with the same weekday in 2025. If you are going this autumn or winter with children who still do not reach the minimum heights, this changes how you split your days.
The data: what we measured and how
- What: the wait Disney posts, recorded every five minutes, on the 32 attractions that were already operating in 2025: 21 in Disneyland Park and 11 in Disney Adventure World. Frozen Ever After and Raiponce are left out because they have no 2025 data. The two Disneyland Railroad trains, too: their wait depends mostly on how frequently the train runs.
- Period: from March 29 to September 29, 2026, with each day paired with the same weekday in 2025 (March 30 to September 30). That is 185 pairs of days.
- Hours: 10:00 to 18:59. Since March 29, both parks close at the same time every day. In 2025, the second park (then Walt Disney Studios) closed earlier than Disneyland Park on 180 of those 186 days; in summer, at 21:00 against 22:40. Comparing full days would mix in evenings that did not exist in 2025.
- Refurbishments: each attraction only counts the days it operated in both years. Big Thunder Mountain was closed until June 21, 2025; Buzz Lightyear, from June 23, 2025; Blanche-Neige, from March 30 to July 27, 2026.
- Controls: French school holidays, days at 30 °C or more (14 in 2025 and 43 in 2026 between March 29 and September 30, according to our weather observations) and the March before the opening, March 1 to 28.
- Limit: we measure queues, not visitors. Disney does not publish attendance per park. In its August 5 shareholder letter it only said it saw “strong attendance growth at Disneyland Paris after the opening of World of Frozen”, with no figure. A longer queue is the most direct sign that there are more people on that attraction, but it does not count those who are eating, strolling or watching a show.
Disneyland Park: the same. Frozen’s park: no
| Group | Attractions | 2025 | 2026 | Change | On normal days* | Before Frozen (Mar 1-28) |
|---|---|---|---|---|---|---|
| Disneyland Park | 21 | 25.5 min | 23.9 min | −6% | +1% | +5% |
| No minimum height | 16 | 22.1 min | 20.7 min | −6% | 0% | +10% |
| With minimum height | 5 | 36.2 min | 33.8 min | −7% | +3% | −5% |
| Disney Adventure World (the 2025 attractions) | 11 | 31.4 min | 36.8 min | +17% | +27% | +11% |
| No minimum height | 6 | 23.1 min | 29.1 min | +26% | +40% | +8% |
| With minimum height | 5 | 41.4 min | 46.0 min | +11% | +18% | +13% |
*Normal days: the 62 pairs of days with no French school holidays in any zone and a high below 30 °C in both years. Posted average wait between 10:00 and 18:59; within each group, every attraction weighs the same. n = 678,082 records in Disneyland Park and 398,027 in Disney Adventure World, over 185 pairs of days. Cutoff: September 29, 2026. Changes calculated without rounding.
The table says three things.
Disneyland Park’s drop is mostly the calendar and the thermometer. In total it falls 6%. But if we remove the French holiday days, it stays at −2%, and on normal days it rises 1%. Between March and September 2026 there were three times as many days at 30 °C or more as in 2025, and in the heat queues drop, as we saw in our heat-wave analysis.
The jump in Disney Adventure World’s family attractions does come with Frozen. In March, before the opening, they waited 8% more than in 2025. Since the opening, 26% more. On normal days, 40%.
The big rides with a minimum height were already rising. Crush’s Coaster, Tower of Terror, RC Racer, Flight Force and Toy Soldiers waited 13% more in March, with Frozen still closed and Ratatouille under refurbishment. After the opening, 11%. Their rise did not start with Frozen.
It confirms what we pointed to in It’s Not the Month, It’s the Park: the gap between the two parks, which was already growing in 2025, has widened in 2026.
Attraction by attraction
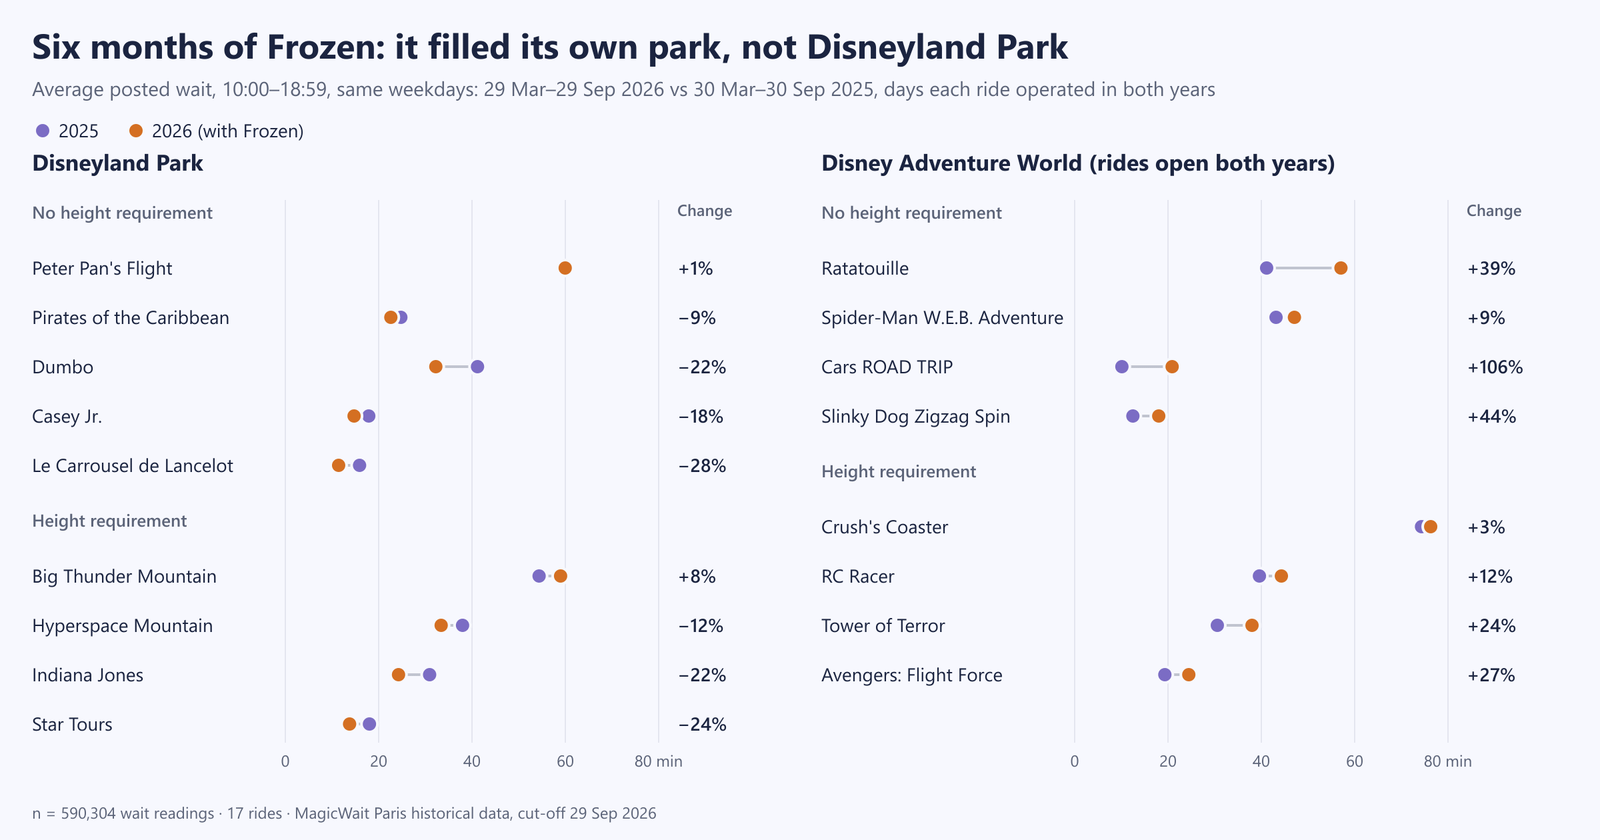
In Fantasyland it shows: Dumbo falls from 41 to 32 minutes, Casey Jr. from 18 to 15 and Le Carrousel de Lancelot from 16 to 11. Peter Pan’s Flight, by contrast, stays the same: 60 minutes in 2025 and 60 in 2026. The only Disneyland Park attractions that rise are Big Thunder Mountain (from 54 to 59) and Buzz Lightyear (from 37 to 41), and for both we can only compare the days they operated in both years: 88 and 85 of 185.
In Disney Adventure World, the biggest riser is Cars ROAD TRIP: from 10 to 21 minutes, double. Slinky Dog goes from 12 to 18. Ratatouille, from 41 to 57: 16 minutes more on every ride. With Ratatouille we have to be cautious: it reopened on March 28 after five and a half months of refurbishment, and part of its rise may be pent-up demand. Crush’s Coaster barely moves, from 74 to 76: it was already the park’s longest queue in 2025.
Month by month: April was the exception
| 2026 period | Disneyland Park 2025 → 2026 | Change | Disney Adventure World 2025 → 2026 | Change |
|---|---|---|---|---|
| Mar 1-28 (before Frozen) | 20 → 21 min | +5% | 29 → 32 min | +11% |
| Mar 29 - Apr 30 | 26 → 21 min | −18% | 36 → 35 min | −3% |
| May | 23 → 22 min | −1% | 30 → 35 min | +15% |
| June | 27 → 26 min | −1% | 32 → 40 min | +27% |
| July | 25 → 22 min | −11% | 31 → 36 min | +17% |
| August | 26 → 23 min | −12% | 30 → 37 min | +22% |
| September (1-29) | 22 → 22 min | 0% | 30 → 40 min | +37% |
Same attractions, same hours (10:00-18:59) and same pairs of days as the previous table.
April is the only stretch in which both parks waited less than in 2025. And it is not the calendar: in those weeks of 2026 there were 27 days of French school holidays, against 20 on the equivalent days of 2025. It coincides with the month in which Frozen had its worst queue, 69 minutes on average and 100 on the first three days, as we told in Frozen Ever After, 6 Months On. Our reading is that a queue like that kept many people in the park, but the data cannot separate it from other causes.
From May on, the pattern is stable. Disneyland Park moves between 0% and −12%, and falls most in July and August, the holiday and heat months. Disney Adventure World rises every month, between 15% and 37%. September’s +37% is inflated by the closure of Crush’s Coaster on September 7: those who were going to Crush’s spread across the others.
When Frozen is packed, so is everything else
The idea that “if Frozen is packed, the rest of the resort will be quieter” does not hold either. We took the 20 days when Frozen was the busiest relative to its own month, 26% above its average. On those days, Disneyland Park waited 5% more than its monthly average and the rest of Disney Adventure World, 8% more. On Frozen’s 19 quietest days the opposite happens: Disneyland Park, 11% less, and Disney Adventure World, 13% less.
Frozen’s bad days are bad days for the whole resort. If you see Frozen at 90 minutes, don’t cross to Disneyland Park thinking it will be empty.
What time it shows
In Disneyland Park, the difference from 2025 is small at any hour: it goes from 7% more at 9:30 to 10% less at 16:00. Opening is not easier than before. On the attractions with no minimum height in Disney Adventure World, the rise is 17% at 10:00, 30% at 11:00 and 39% at 18:00. What has worsened most is the afternoon.
This is how the family attractions of both parks stand today, hour by hour:
| Time | Ratatouille | Spider-Man | Cars ROAD TRIP | Slinky Dog | Dumbo | Peter Pan’s Flight |
|---|---|---|---|---|---|---|
| 8:30 (early access) | 11 min | 5 min | — | 5 min | 5 min | 24 min |
| 9:30 | 44 min | 31 min | 7 min | 6 min | 18 min | 52 min |
| 10:30 | 53 min | 45 min | 21 min | 20 min | 32 min | 57 min |
| 11:30 | 63 min | 52 min | 36 min | 26 min | 32 min | 57 min |
| 13:00 | 61 min | 49 min | 26 min | 21 min | 40 min | 66 min |
| 15:00 | 57 min | 49 min | 20 min | 17 min | 35 min | 61 min |
| 17:00 | 54 min | 45 min | 15 min | 14 min | 29 min | 58 min |
| 18:30 | 51 min | 40 min | 11 min | 12 min | 26 min | 57 min |
| 20:00 | 41 min | 29 min | 11 min | 9 min | 23 min | 49 min |
| 21:30 | 26 min | 15 min | 9 min | 6 min | 20 min | 33 min |
Posted average wait per half hour between March 29 and September 29, 2026, on days each attraction operated. n = 28,624 records (Ratatouille), 29,225 (Spider-Man), 22,378 (Cars ROAD TRIP), 25,185 (Slinky Dog), 23,717 (Dumbo) and 27,035 (Peter Pan’s Flight). Cars ROAD TRIP does not open during early access. The 21:30 row only exists on days with a closing time of 22:00 or later: 168 of 185.
What this means for a family with small children
Let’s take a family with two children aged 3 and 6 going for two days this autumn, one to each park:
- The hard day is no longer the Disneyland Park one. With small children, it is the Disney Adventure World one. Its family attractions wait 26% more than in 2025 and, on normal days, 40% more. If you have early access, use it there.
- Ratatouille, first thing or last thing. At 8:30, during early access, it posts 11 minutes; at 9:30, already 44. Between 10:30 and 18:30 it does not drop below 50. At 21:30, 26.
- Cars ROAD TRIP and Slinky Dog, at opening or from 18:00. At 9:30 they post 7 and 6 minutes; at 11:30, 36 and 26. From 18:30 they are back at 11 and 12.
- Fantasyland is quieter than in 2025, but Peter Pan is not. Dumbo posts 32 minutes on average in the middle hours, 9 fewer than a year ago. Peter Pan is still at 60: either in early access (24 minutes) or in the last hour (33).
- The last hour at Disney Adventure World is no longer wasted. With both parks closing at the same time, it is the best slot for Ratatouille, for Spider-Man and for Frozen itself. In November there are days with a 20:30 closing, so that window moves forward with the closing time.
Verónica’s note
Until this year, with the opening of Frozen, and always going with small children, visits to Disney Adventure World were rare and usually a morning long. This summer, however, with the opening of World of Frozen, we have “enjoyed” the park and the crowds more. The rise in attendance has been very noticeable, and as it is “smaller” (not counting Adventure Way), the build-up of people was much more noticeable. For example, we always used to ride Cars ROAD TRIP with no wait, and this time we had to queue.
Some of the days also coincided with the heat wave, which made things much worse as some of the children’s attractions closed.
In short, the change and the rise in attendance at the park are hugely noticeable, and Disneyland Park’s has not dropped because of it.

Toy Story Playland, one of the family areas of Disney Adventure World.
The decision
Frozen is not going to leave Disneyland Park empty for you: on normal days it waits the same as in 2025. What changes your trip is the other park. If you are going with small children, plan Disney Adventure World as the hard day: Ratatouille in early access or in the last hour, Cars ROAD TRIP and Slinky Dog at opening, and Fantasyland for the quieter day.
Have your dates fixed and small children? Write to us at hello@magicwaitparis.com and we will help you split the days between the two parks. And on the day of your visit, the live queues of both parks are in MagicWait Paris.