

At 11:30, Spider-Man W.E.B. Adventure posts a 53-minute average wait. At 20:30, 17. Same attraction, same day: 36 minutes of difference just from the hour you join the line. And with hotel early access, it posts 6 at 8:30.
No other decision weighs as much. Between a weekday and a weekend, at peak time, there are 5 minutes. Between summer and winter, practically none: a 37-minute average in both seasons. The worst week of the calendar, Easter week, adds between 11 and 15 minutes to the yearly average. Even that does not come close to what you win or lose with the clock.
We measured it with 143,624 wait-time records between January 1, 2024 and September 25, 2026.
The data: what we measured and how
- What we measured: the wait Disney posts for Spider-Man W.E.B. Adventure, recorded every five minutes while the attraction is open. Breakdown or closure periods do not count.
- How much: 143,624 records over almost three years. For 2024 and 2025 there is data for 365 days each year.
- How we summarised it: in half-hour slots. For each one we give the average and the range where 8 out of 10 readings fall (from the 10th to the 90th percentile). That range matters as much as the average: it tells you how far a bad day strays from a normal one.
- What is left out: the slots before 8:30 and after 22:00, with very few readings (1,423 records in total).
One more precision. The attraction opened on July 20, 2022 and our series starts in January 2024: what we measure is an established Spider-Man, not the novelty effect of its first months. And we measure queues, not people. The posted wait is what shapes your day, even if it does not always match to the minute what you end up waiting inside.
The day’s curve, half hour by half hour
| Time slot | Average wait | 8 out of 10 readings |
|---|---|---|
| 8:30 (early access) | 6 min | 5 min |
| 9:00 (early access) | 17 min | 5-40 min |
| 9:30 | 30 min | 10-45 min |
| 10:00 | 43 min | 30-60 min |
| 10:30 | 48 min | 35-65 min |
| 11:00 | 50 min | 35-65 min |
| 11:30 | 53 min | 40-70 min |
| 12:00 | 52 min | 35-70 min |
| 12:30 | 49 min | 35-65 min |
| 13:00 | 48 min | 35-60 min |
| 13:30 | 45 min | 30-60 min |
| 14:00 | 44 min | 30-60 min |
| 14:30 | 44 min | 30-60 min |
| 15:00 | 44 min | 30-60 min |
| 15:30 | 42 min | 30-60 min |
| 16:00 | 42 min | 25-60 min |
| 16:30 | 40 min | 25-55 min |
| 17:00 | 37 min | 20-50 min |
| 17:30 | 35 min | 20-50 min |
| 18:00 | 32 min | 15-45 min |
| 18:30 | 30 min | 15-45 min |
| 19:00 | 27 min | 15-45 min |
| 19:30 | 24 min | 10-40 min |
| 20:00 | 21 min | 5-35 min |
| 20:30 | 17 min | 5-30 min |
| 21:00 (late closure) | 15 min | 5-30 min |
| 21:30 (late closure) | 13 min | 5-25 min |
| 22:00 (late closure) | 9 min | 5-15 min |
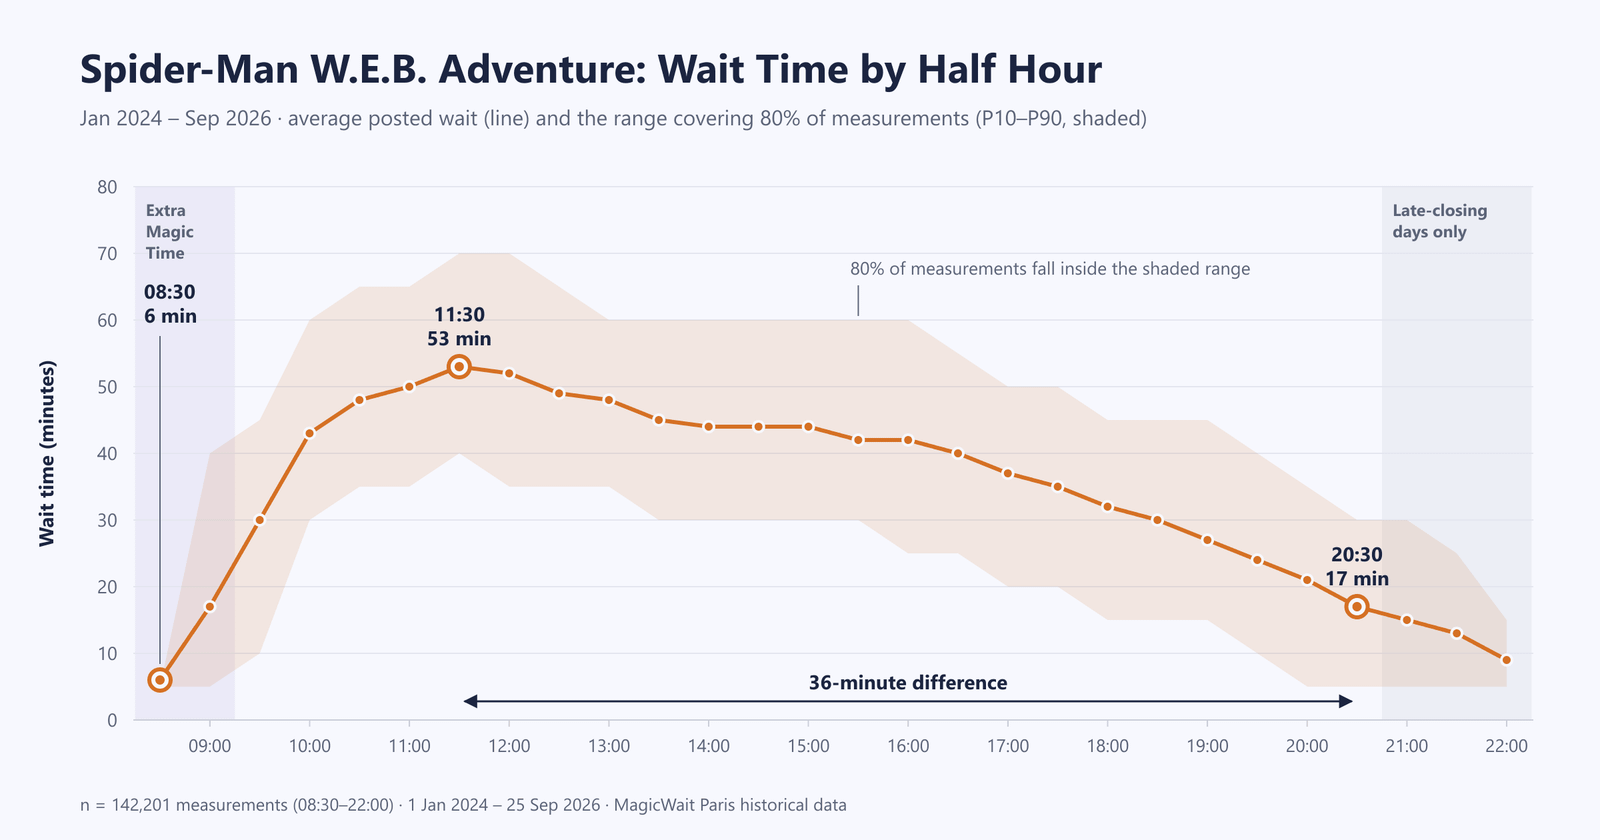
Posted wait for Spider-Man W.E.B. Adventure by half-hour slot. n = 142,201 records between 8:30 and 22:00, from January 1, 2024 to September 25, 2026. The 8:30 and 9:00 slots correspond to early access (Extra Magic Time), reserved for Disney hotel guests and some annual passes. From 21:00 onwards only the days when the park closes late count; that is why the number of records drops so much.
What the curve says
The peak is at 11:30, and lunchtime does not fix it. From 10:00 to 17:00 the average never drops below 40 minutes: seven straight hours. At 13:00, right in the middle of lunch, it is still 48. At 14:30, 44. There is no gap at midday.
At 11:30, the range is also tight at the bottom: 9 out of 10 readings are at 40 minutes or more. It is not that “some days” there is a queue at that hour. It is that there almost always is.
The other way round: if you have read that Spider-Man never drops below an hour all day, the series does not back that up. No slot reaches a 60-minute average. An hour or more appears in the highest 10% of readings between 10:00 and 16:00: it happens, but it is not the norm. Those are wait spikes, never an average.
By general opening, it is already late. At 8:30, with early access barely open, the average is 6 minutes and 9 out of 10 readings mark 5 or less. At 9:00 it is already 17, and in the worst 10% of readings, 40 or more. At 9:30, the usual opening time for everyone, 30. At 10:00, 43. In an hour and a half, the attraction goes from empty to 10 minutes short of its peak.
That leads to the least intuitive conclusion of the whole analysis: without early access, getting up early does not gift you Spider-Man. At 9:30 you find a 30-minute average. At 20:00, 21. At 20:30, 17.
The afternoon falls slowly; the evening, fast. From 12:00 to 17:00, the average drops 15 minutes in five hours (from 52 to 37). From 17:00 to 20:30 it drops 20 in three and a half hours (from 37 to 17). It stays below 30 minutes from 19:00 onwards and below 20 from 20:30 onwards. And the range narrows: at 20:30, 9 out of 10 readings are at 30 minutes or less.
Weekend: between 2 and 5 minutes more (by day)
| Time slot | Monday to Friday | Saturday and Sunday | Difference |
|---|---|---|---|
| 9:30 | 29 min | 33 min | +4 |
| 10:00 | 42 min | 46 min | +4 |
| 11:30 | 51 min | 56 min | +5 |
| 13:00 | 47 min | 50 min | +3 |
| 15:00 | 43 min | 46 min | +3 |
| 17:00 | 36 min | 38 min | +2 |
| 19:00 | 27 min | 27 min | 0 |
| 20:00 | 22 min | 19 min | -3 |
| 21:00 | 16 min | 13 min | -3 |
n = 101,785 records on weekdays and 41,839 on weekends, from January 1, 2024 to September 25, 2026.
During the day, Saturday and Sunday add between 2 and 5 minutes. At night, in fact, they subtract: from 20:00 onwards, the weekend sits 3 minutes below weekdays. We do not have a settled explanation for that crossover. What is clear is that the day of the week moves the wait far less than the hour.
If you can only go on a weekend, you lose almost nothing with Spider-Man. What you do lose, any day, is going at 11:30.
The season changes the evening, not the peak
| Time slot | Winter (Dec-Feb) | Spring (Mar-May) | Summer (Jun-Aug) | Autumn (Sep-Nov) |
|---|---|---|---|---|
| All-day average | 37 min | 38 min | 37 min | 34 min |
| 9:30 | 35 min | 32 min | 26 min | 27 min |
| 11:30 | 56 min | 54 min | 51 min | 51 min |
| 14:00 | 46 min | 45 min | 43 min | 41 min |
| 16:00 | 40 min | 44 min | 45 min | 39 min |
| 18:00 | 28 min | 33 min | 38 min | 28 min |
| 19:00 | 24 min | 28 min | 31 min | 23 min |
| 20:00 | 16 min | 22 min | 26 min | 16 min |
| 20:30 | 11 min | 18 min | 22 min | 12 min |
| 21:00 | n/a | 15 min | 21 min | 9 min |
| 21:30 | n/a | 14 min | 17 min | n/a |
| 22:00 | n/a | 8 min | 11 min | n/a |
The same 142,201 records, split by season. “n/a”: fewer than 300 records in that slot and season.
The 11:30 peak sits between 51 and 56 minutes in all four seasons, and the highest one, curiously, is winter. What really changes is the evening. In winter and autumn, by 20:00 the average has already fallen to 16 minutes. In summer, at the same hour it is still 26, and the worst 10% of readings are at 40 or more. The summer drop arrives at 21:30 (17) and 22:00 (11), on the days when the park stays open late. And the summer afternoon does not even drop: at 16:00 there is more queue than at 14:00 (45 versus 43).
Translated to your plan: in summer, 20:00 is not the good window yet. The rule that holds in all four seasons is another one: the closer to closing, the less queue. In every season, the curve drops without interruption from 17:00 to the end.
The calendar: Easter yes, Halloween no
| Month | 2024 | 2025 |
|---|---|---|
| January | 37 min | 38 min |
| February | 40 min | 38 min |
| March | 44 min | 34 min |
| April | 36 min | 42 min |
| May | 42 min | 35 min |
| June | 34 min | 38 min |
| July | 27 min | 38 min |
| August | 38 min | 38 min |
| September | 34 min | 30 min |
| October | 32 min | 34 min |
| November | 32 min | 29 min |
| December | 34 min | 32 min |
Monthly average wait. n = 51,117 records in 2024 and 52,223 in 2025, with 365 days of data each year.
Two patterns repeat in both years.
The worst month is Easter’s. In 2024, March (44 minutes), with Easter Sunday on March 31. In 2025, April (42), with Easter Sunday on April 20. The week itself, from Palm Sunday to Easter Sunday, is even worse: a 51-minute average in 2024 and 46 in 2025.
From January to May you wait more than from September to December. Weighted by records, a 38.6-minute average from January to May, 35.5 in summer and 32.1 from September to December. The eight months from September to December in both years sit between 29 and 34 minutes; of the ten from January to May, eight are at 36 or more. That is why the winter average comes out the same as the summer one: it combines a quiet December (32-34) with a loaded January and February (37-40).
| Period | 2024 | 2025 | Days per year |
|---|---|---|---|
| Easter week | 51 min | 46 min | 8 |
| Christmas (Dec 24 - Jan 1) | 41 min | 38 min | 9 |
| Full year | 36 min | 35 min | 365 |
| Summer (July and August) | 33 min | 38 min | 61-62 |
| Halloween (Sep 26 - Nov 1) | 33 min | 33 min | 37 |
Average wait in each period, with the same date windows both years. Christmas: 2024/25 and 2025/26.
Halloween, 33 minutes both years: below the annual average. It fits with what we measured in the Halloween effect: the attractions of Disney Adventure World do not notice that it is October. Rain does not move it either: the same daily median, 40 minutes, on rainy days and dry days, according to our rain analysis.
If you can choose your dates, the uncomfortable truth for anyone travelling from Spain is this: Easter week is the worst week we have measured for Spider-Man. And the last third of the year, the best. With a nuance that arrives in 2026.
2026 runs above the series
| Quarter | 2024 | 2025 | 2026 |
|---|---|---|---|
| January-March | 41 min | 37 min | 37 min |
| April-June | 37 min | 38 min | 35 min |
| July-September | 33 min | 36 min | 42 min |
| October-December | 33 min | 32 min | n/a |
Average wait by quarter. 2026: up to September 25.
From July to September 2026, Spider-Man has posted a 42-minute average: the highest quarter since we started measuring, 6 minutes above the same quarter of 2025 and 9 above 2024.
It is the first summer of Disney Adventure World, which debuted its name and World of Frozen on March 29, 2026, and it is the explanation that jumps out. But it does not quite fit: the quarter right after the opening, April to June, stayed at 35 minutes, below both previous years. With this data we cannot attribute the jump to a single cause.
What it does imply: if you go this autumn, do not take the 29-34 minute averages of previous autumns for granted. The shape of the curve has not changed, though: in the 33 months of the series, the lowest-wait slot of each month always fell at one end of the day, first thing or at night, never in a central slot. What has risen in 2026 is the level.
What this means for your day
Spider-Man has no minimum height, so it is one of those attractions a family with young children can ride whole, all together. And that is exactly the plan that fits its curve worst if you do not think it through: arriving mid-morning, heading straight to Avengers Campus and hitting the 11:30 peak.

The Spider-Man W.E.B. Adventure boarding area: eight-seat vehicles, in two rows of four.
Depending on your case:
- With early access (Disney hotel): Spider-Man in the first half hour, from 8:30 to 9:00. A 6-minute average; 9 out of 10 readings, 5 or less. By 9:15 it is no longer the same: the 9:00 slot comes out at 17 on average. How to fit it with the rest of the extra hour, we cover in the Extra Magic Time guide.
- Without early access and with kids who can hold out until closing: the last hour and a half of the day. At 20:00, a 21-minute average; at 20:30, 17. In summer, if the park closes late, wait for 21:30 (17) or 22:00 (11).
- Without early access and with kids who do not make it to the evening: from 17:30 you are already almost 20 minutes below the peak (35 on average), and at 18:30, at 30. It is not the good window, but it is the least bad one by day. The one that does not work is lunchtime: at 13:00 it is still 48.
- If you are going to pay for Premier Access: make it for the 10:30 to 13:30 slot, when the average is between 45 and 53 minutes. Paying for it at 20:30 is paying to save yourself 17.
📱 The curve is the average of almost three years; your day is not. If by 19:00 Spider-Man has already dropped to 15 minutes, waiting until 20:30 is wasted time. And in a 2026 that runs above the series, the historical average falls short. In MagicWait Paris you see Spider-Man’s live wait and the rest of the park’s on the same screen. Access it for free!
A Note from Verónica: Trust the Data, It Does Not Lie
We have been many times, at different hours and on different dates, and the data does not lie. Unless a breakdown happens during the busiest hours, the attraction closes and the wait restarts from zero when it reopens, the queue is unlikely to drop. It is a ride for the whole family and well worth doing, so waiting until the end of the day is the price you pay to save time. From the moment you enter it is an immersive experience, because it starts telling a story, and although the volume is a bit high, little ones love it because it is so interactive.
Summary: what each decision weighs
| Decision | Difference in average wait |
|---|---|
| Time of day, with early access: 8:30 vs 11:30 | 47 min |
| Time of day, without early access: 20:30 vs 11:30 | 36 min |
| Easter week vs the full year | 11-15 min |
| January to May vs September to December | 6.5 min |
| Weekend vs weekday, at 11:30 | 5 min |
| Summer vs winter | 0 min |
MagicWait Paris’s own data, from January 1, 2024 to September 25, 2026. Easter week and month-by-month comparison: 2024 and 2025.
The decision
Spider-Man is not a “when we pass by Avengers Campus” ride. You ride it at one of the two ends of the day: at 8:30 if you have early access, and in the last hour and a half before closing if you do not. If your day does not stretch to the evening, from 17:30 onwards. What does not work, not even in low season or on a Tuesday, is going between 10:00 and 14:00.
Have fixed dates and want to know where Spider-Man fits in your day? Write to us at hello@magicwaitparis.com. And for the live wait, MagicWait Paris.