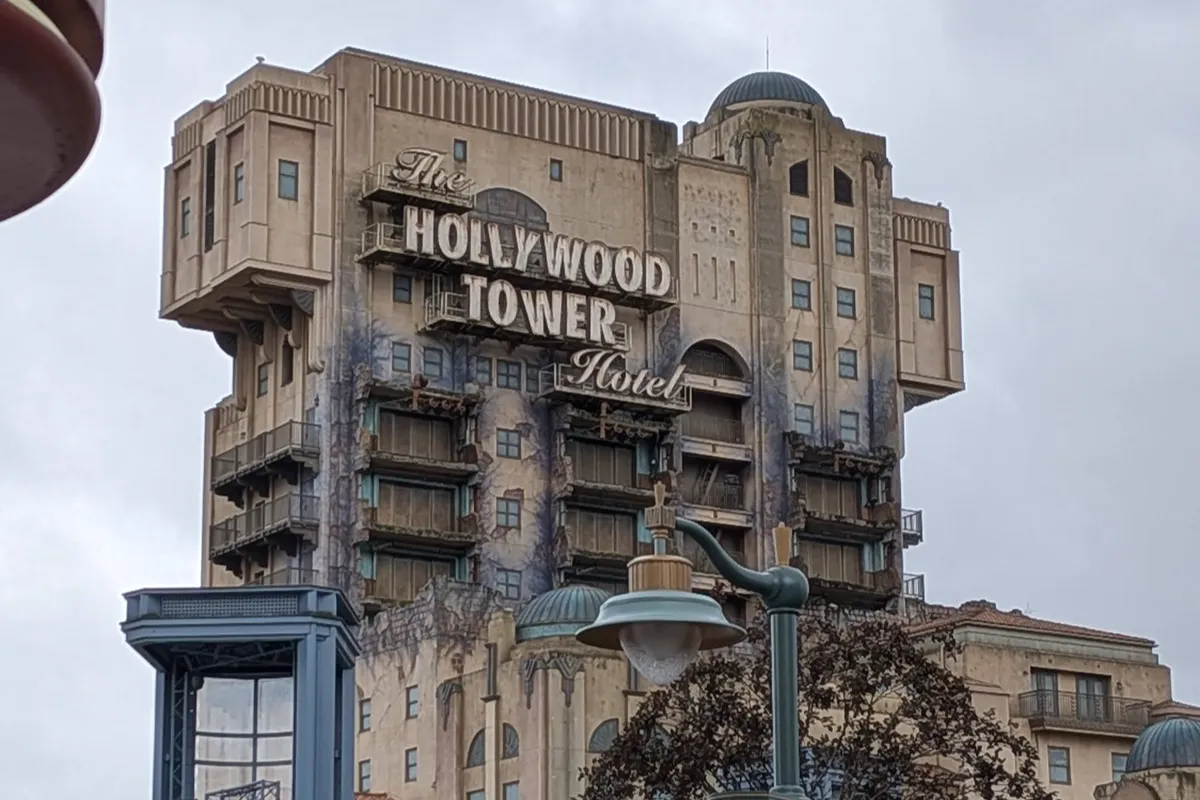
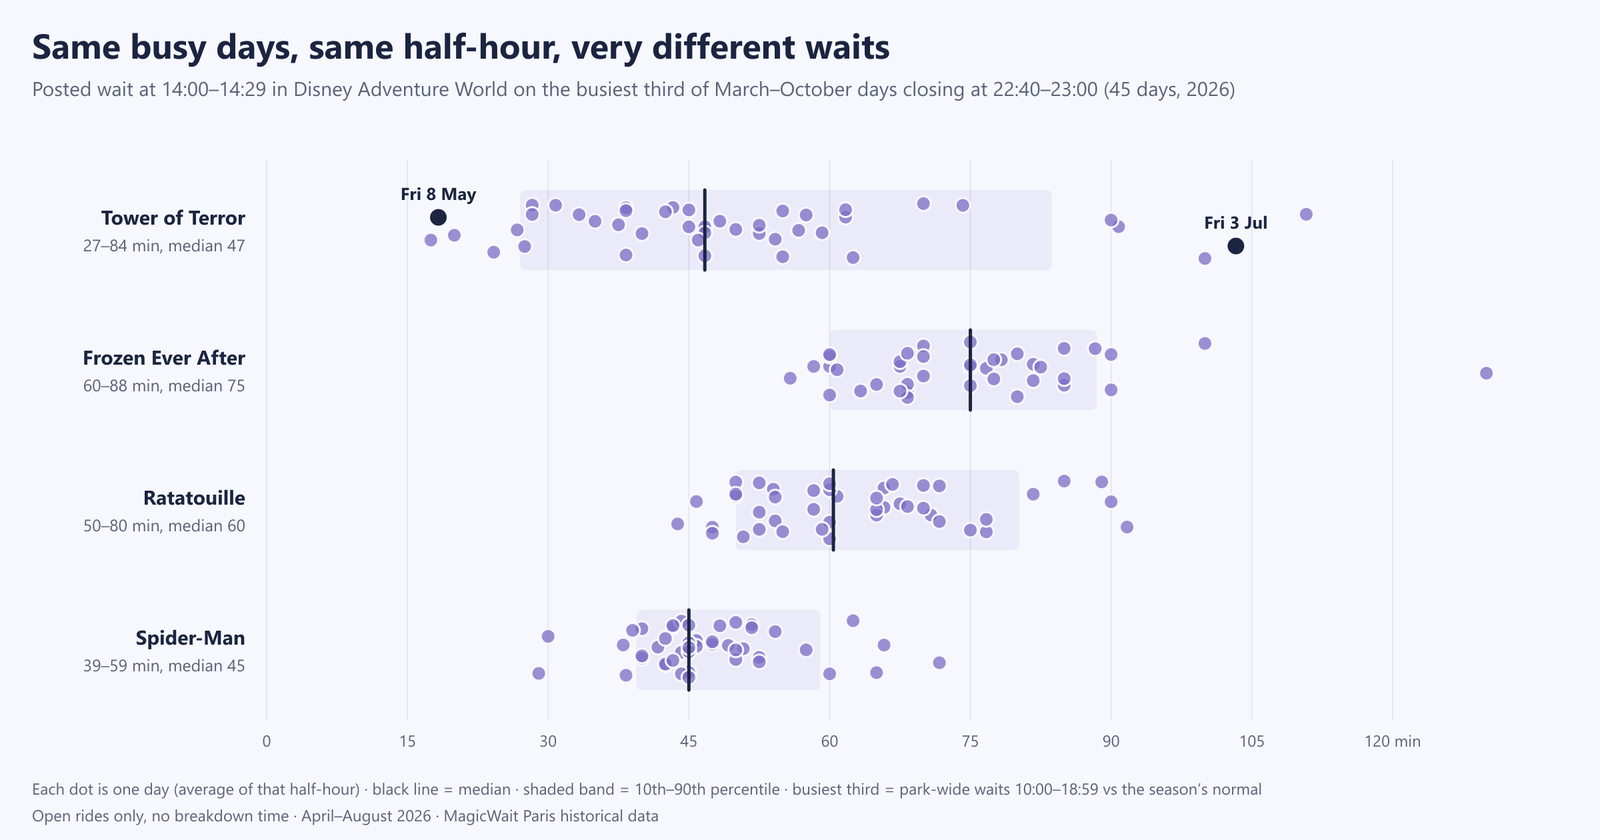
At 14:00 (2 pm) on a busy spring or summer day, The Twilight Zone Tower of Terror posts between 27 and 84 minutes eight days out of ten. This is not a quiet day against an August one: these are days in the same season, with the same opening hours and with the park just as full. On Friday, May 8, 2026, a public holiday in France, it showed 20 minutes at that time. On Friday, July 3, with almost the same crowd in Disney Adventure World, 110. And at 14:40 that same day, 40.
It is the biggest lottery in both parks: at the same half-hour, there are 30 minutes on average between a good day and a bad one. Next come Frozen Ever After (29.5) and, at Disneyland Park, Big Thunder Mountain (24.6) and Autopia (24.3). At the other end, Slinky Dog and It’s a small world, with 8-9 minutes. And Peter Pan’s Flight, the ride with the longest queue at Disneyland Park, is the most reliable relative to its wait: a lot, but almost always the same.
At Disneyland Paris there will always be surprises: a ride that breaks down, a downpour or a parade that pulls the crowd away just as you reach the queue. But the data says they are not what weighs most on your wait. Knowing the season and whether the day is quiet or busy explains between a quarter and a third of the variation; breakdowns, rain and the parade, only between 3% and 6%. The rest depends on things nobody can anticipate, and they affect you whether you have a plan or not. The difference lies in everything else, and that can be prepared.
Improvising as you go isn’t the answer either: checking the app with an hour of leeway saves you barely 2 to 5 minutes per ride. What really changes the day is deciding in advance when to go to each one: going in its best half-hour instead of at midday saves 58 minutes on Frozen, 37 on Big Thunder and 20 on Tower of Terror. And in that best half-hour, which for the big rides is usually the last one before closing, the plan almost always holds: coming out 15 minutes worse than expected happens on around 2% of days.
We measured it with 4.3 million wait-time readings from 34 rides, grouped into 657,959 half-hours, across 2,016 park days between January 1, 2024 and November 15, 2026. This article is for anyone who plans the day by the hour, “Tower of Terror at 14:00, Ratatouille at 15:00”, and wants to know which rides make that time a safe bet and which ones need some leeway.
The data: what we measured and how
- What we measure: the wait Disney posts, recorded every five minutes, for the 34 rides we track in both parks, excluding the railroad. It only counts while the ride is open: closures and breakdowns are left out. For each day, the average of each half-hour.
- Similar days: same ride, same half-hour, same park, same schedule season (winter or March to October, and the closing time) and same crowd level. For the crowd level we split each season’s days into three groups, quiet, medium and busy, by the wait from 10:00 to 18:59 compared with the normal level for that season. The first hour counts from opening and the last one up to closing, so that “the last half-hour” is the same whether the park closes at 20:00 or at 23:00. Only combinations with 20 days or more count: 10,835.
- How we measure the lottery: the two waits between which eight out of ten similar days fall (10th to 90th percentile). The difference between them is what’s at stake, the swing. To compare long and short queues we also use the coefficient of variation: how much the wait spreads relative to its average.
- What we leave out: six rides whose figure barely moves: Les Mystères du Nautilus, Alice’s Curious Labyrinth, La Cabane des Robinson, Mad Hatter’s Tea Cups, Le Pays des Contes de Fées and Le Carrousel de Lancelot. They spend between 77% and 100% of the time showing the same figure for an hour or more. They would come out as the most reliable only because Disney doesn’t update the figure.
- What we don’t measure: the actual queue. Disney posts an estimate, and when it jumps from 60 to 110 minutes in five minutes, that doesn’t mean the queue has doubled, only that the estimate has changed. But it’s the figure you decide with.
Data updated as of November 15, 2026.
The most unpredictable and the most reliable
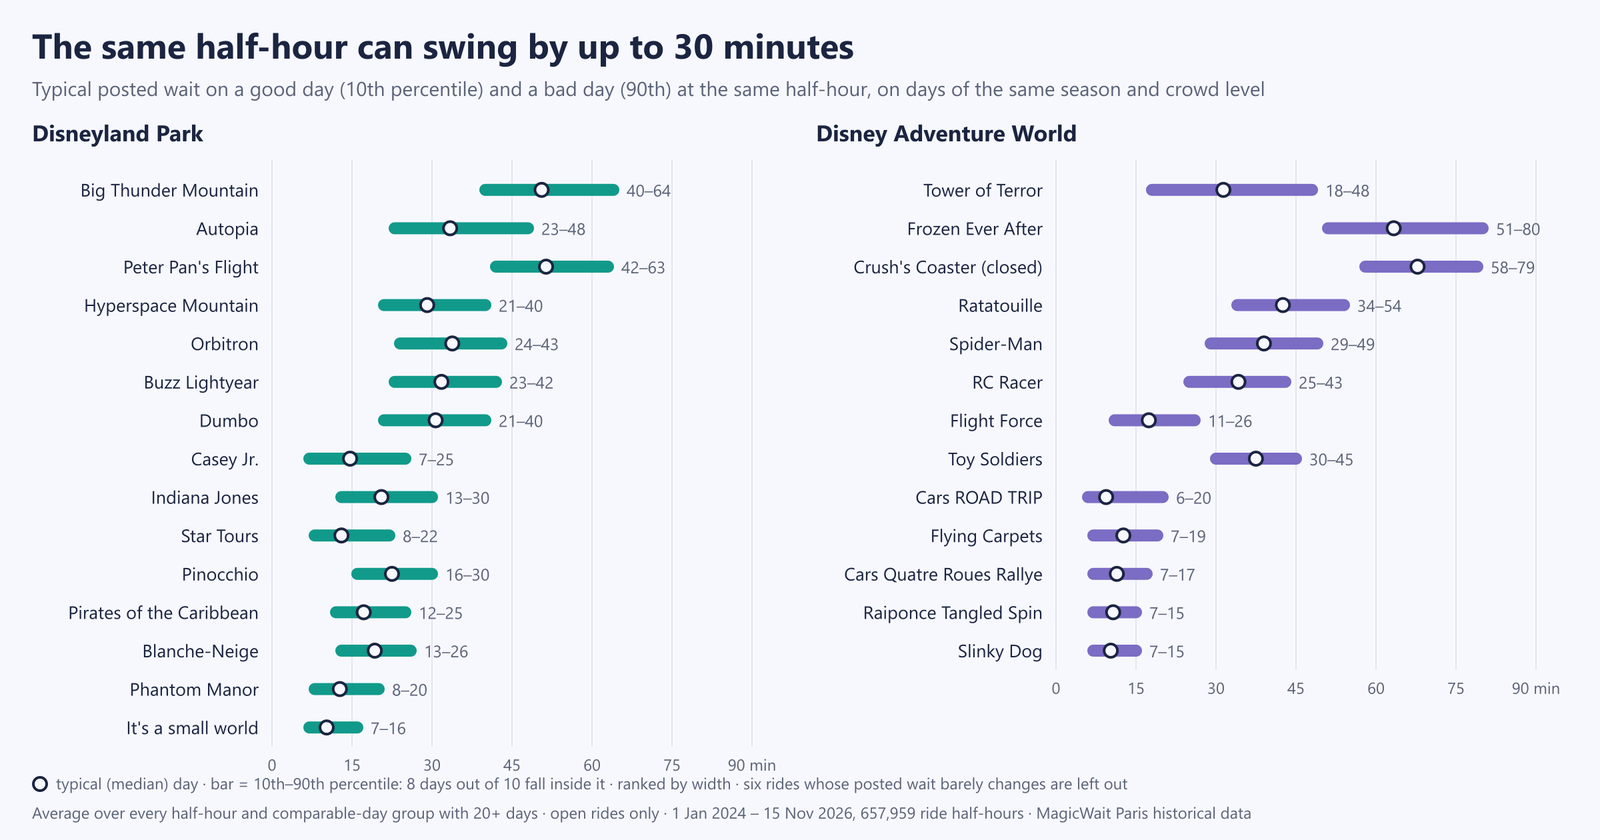
| Ride | Average wait | 8 days out of 10, between… | The swing |
|---|---|---|---|
| Disneyland Park: the most unpredictable | |||
| Big Thunder Mountain | 51.5 min | 40 and 64 min | 24.6 min |
| Autopia | 34.8 min | 23 and 48 min | 24.3 min |
| Peter Pan’s Flight | 52.1 min | 42 and 63 min | 21.6 min |
| Star Wars Hyperspace Mountain | 30.0 min | 21 and 40 min | 19.5 min |
| Orbitron | 33.6 min | 24 and 43 min | 19.5 min |
| Disneyland Park: the most reliable | |||
| Les Voyages de Pinocchio | 22.7 min | 16 and 30 min | 13.4 min |
| Pirates of the Caribbean | 17.8 min | 12 and 25 min | 13.3 min |
| Blanche-Neige et les Sept Nains | 19.6 min | 13 and 26 min | 13.0 min |
| Phantom Manor | 13.6 min | 8 and 20 min | 12.5 min |
| It’s a small world | 10.9 min | 7 and 16 min | 8.8 min |
| Disney Adventure World: the most unpredictable | |||
| The Twilight Zone Tower of Terror | 32.7 min | 18 and 48 min | 30.2 min |
| Frozen Ever After | 64.9 min | 51 and 80 min | 29.5 min |
| Crush’s Coaster (closed until 2027) | 68.2 min | 58 and 79 min | 21.0 min |
| Ratatouille | 43.5 min | 34 and 54 min | 20.7 min |
| Spider-Man W.E.B. Adventure | 39.3 min | 29 and 49 min | 19.8 min |
| Disney Adventure World: the most reliable | |||
| Cars ROAD TRIP | 11.6 min | 6 and 20 min | 14.3 min |
| Les Tapis Volants | 13.0 min | 7 and 19 min | 11.6 min |
| Cars Quatre Roues Rallye | 11.9 min | 7 and 17 min | 9.9 min |
| Raiponce Tangled Spin | 11.1 min | 7 and 15 min | 8.1 min |
| Slinky Dog Zigzag Spin | 10.8 min | 7 and 15 min | 8.0 min |
Average over all of each ride’s half-hours, each group of similar days weighted by its number of days: it’s the typical width at any given time, not across the whole day. January 1, 2024 to November 15, 2026. Big Thunder Mountain, from June 21, 2025; Frozen Ever After and Raiponce, from late March 2026; Crush’s Coaster, until September 6, 2026. Without the six rides whose figure barely moves.
In minutes, the lottery belongs to the big rides. It makes sense: where you wait an hour there is more room for it to go well or badly. The five most unpredictable rides in each park are also among those with the longest queues.
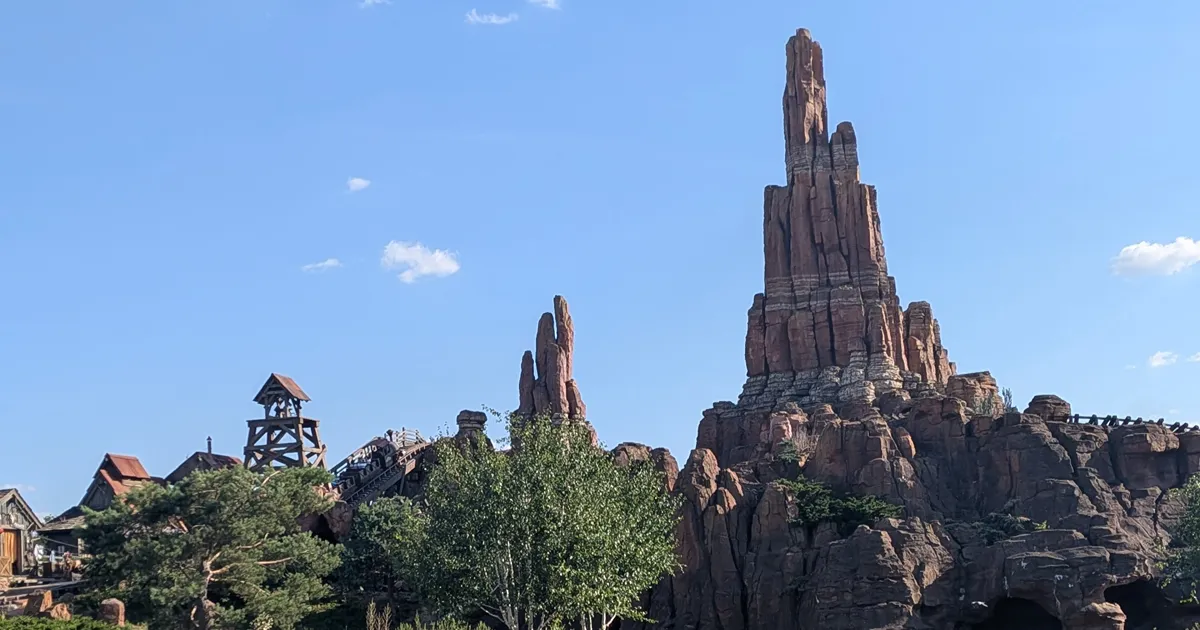
Tower of Terror is the odd one out. It has half Frozen’s queue and the same swing. At 14:00 on busy days, Spider-Man and Tower of Terror have almost the same median, 45 and 47 minutes. But eight days out of ten, Spider-Man posts between 39 and 59, and Tower of Terror between 27 and 84.
Big Thunder has no good time, and no safe time either. We already showed that its queue barely drops all day. Now we also know its swing is the same at any time: between 23 and 26 minutes at opening, at midday, in the afternoon and in the last hour.
And you can know it in advance. Being a lottery ride is not a one-year thing: repeating the ranking for 2024, 2025 and 2026 separately, the order barely changes (correlation of 0.85 to 0.98 with the full-series ranking). Tower of Terror is first in Adventure World all three years, and Autopia first or second at Disneyland Park. Using the month instead of the season to define similar days gives the same result (0.98). In other words: you can plan knowing which ones they are.
Relative to their wait, the lottery is in the small rides
Fifteen minutes of difference don’t weigh the same on an hour-long queue as on a ten-minute one. Measured relative to their wait, the ranking flips:
| Ride | Park | Average wait | The swing | As % of its normal wait | Rank in minutes | Rank relative to wait |
|---|---|---|---|---|---|---|
| Peter Pan’s Flight | Disneyland | 52.1 min | 21.6 min | 42% | 3rd | 15th (last) |
| Big Thunder Mountain | Disneyland | 51.5 min | 24.6 min | 49% | 1st | 14th |
| Casey Jr. | Disneyland | 15.6 min | 17.7 min | 121% | 8th | 1st |
| Star Tours: The Adventures Continue | Disneyland | 14.1 min | 14.2 min | 109% | 10th | 2nd |
| Phantom Manor | Disneyland | 13.6 min | 12.5 min | 98% | 14th | 3rd |
| Toy Soldiers Parachute Drop | Adventure World | 37.3 min | 14.3 min | 38% | 8th | 12th |
| The Twilight Zone Tower of Terror | Adventure World | 32.7 min | 30.2 min | 96% | 1st | 2nd |
| Cars ROAD TRIP | Adventure World | 11.6 min | 14.3 min | 152% | 9th | 1st |
Ranks within each park, among 15 rides at Disneyland Park and 13 at Disney Adventure World; “relative to wait” ranks by coefficient of variation. “As % of its normal wait”: the swing divided by the median wait. Same period and same similar days as the previous table.
Peter Pan is a long queue, but a predictable one. The swing is 42% of its normal wait, the lowest at Disneyland Park. You know what you’re going to get, even if it’s a lot. Why its queue hardly ever drops we cover separately.
The small rides are the most capricious. At Casey Jr., Star Tours or Phantom Manor, the swing is as big as what they usually post. In minutes it’s 12-18, so they won’t ruin your plan, but it isn’t worth crossing the park for them without checking first.
Cars ROAD TRIP is a this-year story. Until March 2026, its average wait from 10:00 to 18:00 was between 6 and 13 minutes depending on the month; since April, coinciding with the opening of the Frozen area, it has been between 15 and 37. In 2026 it is already the third most unpredictable ride in Adventure World in minutes.
Tower of Terror is the only lottery on both measures. It has a long queue and an unpredictable one: the swing is almost as big as its normal wait (96%).
When it’s a lottery and when it isn’t
| Ride | First hour | Until 12:00 | 12:00-15:00 | Afternoon | Last hour |
|---|---|---|---|---|---|
| Disneyland Park, all rides | 12.8 | 18.7 | 19.2 | 16.6 | 10.2 |
| Big Thunder Mountain | 26.3 | 24.1 | 24.4 | 24.6 | 23.5 |
| Autopia | 26.7 | 24.4 | 21.6 | 25.9 | 21.0 |
| Peter Pan’s Flight | 21.6 | 23.2 | 23.5 | 20.5 | 12.0 |
| Star Wars Hyperspace Mountain | 22.0 | 21.1 | 20.3 | 19.1 | 14.5 |
| Disney Adventure World, all rides | 17.3 | 19.9 | 17.9 | 15.7 | 12.7 |
| The Twilight Zone Tower of Terror | 31.7 | 31.8 | 30.5 | 30.1 | 25.9 |
| Frozen Ever After | 42.3 | 32.7 | 31.1 | 27.9 | 17.8 |
| Ratatouille | 23.0 | 22.9 | 21.9 | 20.1 | 15.0 |
| Spider-Man W.E.B. Adventure | 24.6 | 20.3 | 19.9 | 19.4 | 16.5 |
Minutes at stake (difference between the 10th and 90th percentile on similar days) in each part of the day. First hour: from official opening, without Extra Magic Time. Afternoon: from 15:00 until one hour before closing. Last hour: the 60 minutes before park closing. January 1, 2024 to November 15, 2026.
The lottery is played at midday. Taking all rides together, the most unpredictable stretch runs from mid-morning to 15:00, and the most reliable is the last hour: at Disneyland Park, a 19.2-minute swing at midday against 10.2 at the end.
For the big rides, the first hour isn’t safe. Frozen has its biggest swing at opening: 42 minutes. And it’s the ride that opens late most often: one morning in six, as we showed in our analysis of late openings. At Big Thunder, Autopia, Hyperspace, Ratatouille and Spider-Man, the first hour is also their most variable stretch.
Tower of Terror and Big Thunder have no safe stretch. Both sit at 23-32 minutes of swing at any time, the last hour included.
The last half-hour, ride by ride:
| Ride | 8 days out of 10, between… | Median | Days at 10 min or less | Days it doesn’t drop below that day’s median |
|---|---|---|---|---|
| Pirates of the Caribbean | 5 and 7 min | 5 min | 99% | 7% |
| Indiana Jones and the Temple of Peril | 5 and 7 min | 5 min | 98% | 5% |
| Buzz Lightyear Laser Blast | 5 and 13 min | 8 min | 70% | 0% |
| Star Wars Hyperspace Mountain | 5 and 18 min | 10 min | 54% | 1% |
| Peter Pan’s Flight (since April 2026) | 8 and 19 min | 13 min | 32% | 0% |
| Spider-Man W.E.B. Adventure | 5 and 25 min | 10 min | 51% | 0% |
| Ratatouille | 5 and 23 min | 12 min | 44% | 0% |
| Frozen Ever After | 9 and 29 min | 17 min | 14% | 0% |
| The Twilight Zone Tower of Terror | 5 and 35 min | 16 min | 34% | 12% |
| Big Thunder Mountain | 11 and 35 min | 23 min | 10% | 1% |
| Autopia | 13 and 34 min | 20 min | 4% | 8% |
| Toy Soldiers Parachute Drop | 7 and 31 min | 18 min | 22% | 1% |
Wait in the last half-hour before park closing, every day with data. January 1, 2024 to November 15, 2026; Peter Pan’s Flight closed an hour before the park until April 4, 2026, so its data is from after that date. “Doesn’t drop below that day’s median”: the last half-hour has as much queue as that ride’s median that day, or more. Dumbo, Pinocchio, Blanche-Neige and Cars ROAD TRIP close before the park and are not included.
The end of the day is the safest bet, but not for every ride. At Pirates and Indiana Jones, the last half-hour almost always comes in at 5 minutes, and at Buzz Lightyear at 10 or less seven days out of ten. At Tower of Terror and Autopia, one day in eight or twelve the last half-hour doesn’t drop below that day’s normal. And Big Thunder almost always drops, but can stay at 35.
Busy days are more unpredictable in minutes, not in proportion. At Disneyland Park, the swing goes from 15.5 minutes on quiet days to 18.7 on busy ones, but relative to the wait it falls (coefficient of variation from 0.35 to 0.31). A busy day is more expensive, not more capricious.
What can be predicted and what can’t
The shape of the day can be predicted. When each ride drops and which ones are lotteries repeats year after year: that’s what makes planning possible, and what saves the most minutes, as we’ll see in the next section.
The type of day can be partly predicted. A busy day raises the average wait of Disneyland Park’s rides by 52% compared with a quiet day in the same season (31.2 minutes against 20.5), and Tower of Terror’s by 79% (42.6 against 23.8). Knowing the season and whether the day will be busy explains between a quarter and a third of how the wait changes from one day to another.
Breakdowns explain very little. With the ride closed there’s no wait, so stoppages are already left out. Also removing the hour after each reopening, when the queue comes back all at once, the swing drops by only 2%; the most at Ratatouille (4.3%) and Big Thunder (4%). Spider-Man, which stops almost twice a day, by only 2.5%. Which rides stop the most is in our breakdowns ranking.
Rain lowers the queue at outdoor rides, but doesn’t make it more predictable. In the rain, Orbitron posts 7.5 minutes less than usual for that time; Dumbo, 5.9; Big Thunder, 5.7; RC Racer, 5.2. Removing the rainy half-hours changes the swing by little more than a minute at most.
The parade doesn’t add to the lottery. It lowers the queue while it passes, as we showed in our parade analysis, but it runs at the same time almost every day, so it’s already part of what’s normal for that half-hour.
Neither do Premier Access and Single Rider. Rides with Premier Access are more unpredictable in minutes (18.6 against 13.8), but because they have longer queues: among rides with 30 minutes or more, their coefficient of variation is the same (0.25 against 0.24). Single Rider rides, at equal queue length, are somewhat more predictable (0.21 against 0.28).
| Ride | Explained by season and crowd level | Breakdowns, rain and parade | Unexplained (lottery) |
|---|---|---|---|
| Disneyland Park, all rides | 25% | 6% | 69% |
| Disney Adventure World, all rides | 31% | 3% | 66% |
| Autopia | 14% | 3% | 83% |
| Raiponce Tangled Spin | 18% | 1% | 81% |
| Frozen Ever After | 10% | 10% | 80% |
| The Twilight Zone Tower of Terror | 25% | 0% | 75% |
| Peter Pan’s Flight | 23% | 5% | 72% |
| Big Thunder Mountain | 23% | 11% | 66% |
| Spider-Man W.E.B. Adventure | 39% | 4% | 57% |
| Pirates of the Caribbean | 44% | 5% | 51% |
| Ratatouille | 52% | 4% | 44% |
Breakdown of the variation in wait at the same half-hour from one day to another (variance), February 27, 2025 to November 15, 2026: before that date stoppages can’t be seen. “Unexplained” is what’s left, and it includes what changes from one day to another within the same crowd group, so it’s an upper bound.
What can’t be predicted is whether you’ll get the good day or the bad one. Two thirds of how the wait changes between similar days has no explanation in our data; at Autopia, more than four fifths. At Ratatouille, on the other hand, knowing what kind of day it is explains more than half. No plan removes that part. What the plan does decide is at what time you take your chances, and with how much queue.
Planning the moment: what saves the most minutes
| Ride | Wait at midday | Swing at midday | Wait in its best half-hour | Swing there | Planning saves you | Checking the app on the go adds |
|---|---|---|---|---|---|---|
| Frozen Ever After | 76 min | 31 min | 18 min | 16 min | 58 min | 4.6 min |
| Ratatouille | 52 min | 22 min | 14 min | 13 min | 39 min | 4.7 min |
| Big Thunder Mountain | 61 min | 24 min | 24 min | 23 min | 37 min | 4.6 min |
| Spider-Man W.E.B. Adventure | 47 min | 20 min | 13 min | 15 min | 34 min | 4.0 min |
| Buzz Lightyear Laser Blast | 41 min | 20 min | 9 min | 7 min | 31 min | 5.2 min |
| RC Racer | 43 min | 17 min | 12 min | 14 min | 31 min | 4.6 min |
| Star Wars Hyperspace Mountain | 38 min | 20 min | 11 min | 11 min | 28 min | 3.2 min |
| Orbitron | 41 min | 20 min | 15 min | 17 min | 26 min | 4.1 min |
| Toy Soldiers Parachute Drop | 43 min | 13 min | 19 min | 17 min | 24 min | 4.0 min |
| The Twilight Zone Tower of Terror | 37 min | 31 min | 17 min | 23 min | 20 min | 3.8 min |
| Peter Pan’s Flight | 59 min | 23 min | 40 min* | 16 min | 19 min* | 4.2 min |
| Autopia | 38 min | 22 min | 22 min | 19 min | 15 min | 4.7 min |
Average wait and swing (difference between the 10th and 90th percentile) on similar days. “At midday”: from 12:00 to 14:59. “Its best half-hour”: the one with the lowest average wait in each season and crowd level, among those with data on at least 60% of days; almost always the last one before closing, and the first one at Orbitron and RC Racer. January 1, 2024 to November 15, 2026. “Checking the app on the go adds”: what you save on top by having an hour of leeway and choosing the moment from the live wait (simulation with real readings from February 27, 2025 to November 15, 2026, explained in the next section). *Peter Pan’s Flight closed an hour before the park until April 4, 2026; since then, its last half-hour has posted a median of 13 minutes.
Planning the moment saves 3 to 13 times more than improvising. At Frozen, going in its best half-hour instead of at midday is 58 minutes less; checking the app on the go, 4.6. At Big Thunder, 37 against 4.6. Even at Tower of Terror, the biggest lottery, planning saves 20 minutes and reacting 3.8.
And for many rides, the plan also shrinks the lottery. In its best half-hour, Frozen goes from a 31-minute swing to 16, Buzz Lightyear from 20 to 7 and Ratatouille from 22 to 13. At Big Thunder and Autopia the swing barely drops, and at Tower of Terror it stays at 23 minutes: with them, the plan gives you less queue, but not much more certainty.
The plan almost always holds. In their best half-hour, coming out 15 minutes worse than expected happens on 1.6% of days at Disneyland Park and 2.2% at Adventure World. The ones that miss most are, precisely, the lottery rides: Tower of Terror (8.5% of days), Big Thunder (6.7%) and Autopia (5.7%).
Not everything fits into the last half-hour. That’s why you need a plan: deciding what goes at the end, what goes first thing and what fills the middle of the day, as we explained in our article on arriving at 2 pm. And in that middle of the day, give the lottery rides some leeway: a slot with two or three options nearby works better than a fixed time.
📱 The plan saves the big minutes; live data, the small ones. In MagicWait Paris you have each ride’s hour-by-hour forecast to place the lottery rides at their best moment when you build your plan, and the live wait to change the order if you get the bad day.
On the day: the app to fine-tune the plan
| Ride | Jumps of 15 min or more per day | Dips of 10 min or more below normal, per day | How long a dip lasts (median) | Last 30 min or more |
|---|---|---|---|---|
| Ratatouille | 11.3 | 5.9 | 10 min | 11% |
| Autopia | 11.1 | 6.2 | 15 min | 16% |
| The Twilight Zone Tower of Terror | 10.3 | 5.9 | 15 min | 27% |
| Frozen Ever After | 9.2 | 5.2 | 15 min | 30% |
| Buzz Lightyear Laser Blast | 8.1 | 4.8 | 10 min | 10% |
| Big Thunder Mountain | 7.7 | 4.2 | 15 min | 24% |
| Spider-Man W.E.B. Adventure | 5.9 | 5.6 | 15 min | 16% |
| Peter Pan’s Flight | 5.4 | 3.7 | 15 min | 15% |
| Dumbo the Flying Elephant | 3.5 | 2.9 | 25 min | 43% |
| Pirates of the Caribbean | 1.1 | 2.1 | 15 min | 21% |
February 27, 2025 to November 15, 2026, from opening to closing, with readings every five minutes. “Jumps”: a change of 15 minutes or more between two consecutive readings. “Dip”: the wait is 10 minutes or more below what’s normal for that half-hour on similar days; it lasts until it rises again. Dips that end in a closure are not counted. “Checking the app on the go” (previous table): with an hour of leeway, from 15 minutes before to 45 minutes after the planned half-hour, you check the app 15 minutes before, at the start, after 15 and after 30 minutes, and go in as soon as the wait is at its normal level or below; if it doesn’t drop, at the last check.
The big rides’ figure moves all the time. Autopia, Ratatouille and Tower of Terror change by 15 minutes or more from one reading to the next about ten or eleven times a day. Pirates, once.
When it drops, you have about 15 minutes. Half of the dips at Big Thunder, Peter Pan, Frozen or Tower of Terror last a quarter of an hour or less; at Buzz Lightyear and Ratatouille, ten minutes. If it catches you on the other side of the park, you’ll often arrive when it’s already back up. One in four dips at Tower of Terror, and almost one in three at Frozen, lasts half an hour or more.
The app fine-tunes the plan, it doesn’t replace it. Waiting for the wait to drop, with an hour of leeway, saves you between 1.6 and 5.2 minutes per ride. The reason: the lottery is between days, not between moments. If Tower of Terror posts 80 at 14:00 today, waiting half an hour rarely fixes it. What works is what you already have in your plan: its best moment and another ride nearby to change the order.
How to plan the lottery rides
| Type | Rides | How to plan them |
|---|---|---|
| Lottery with a long queue | Tower of Terror, Frozen Ever After, Big Thunder Mountain, Autopia, Ratatouille | In their best half-hour, almost always the last one. If they have to go at midday, in a slot with two or three options nearby, not at a fixed time |
| Long queue, but predictable | Peter Pan’s Flight, Toy Soldiers Parachute Drop | You know what you’ll get: the surprise is small for the size of the wait. Peter Pan, in the last half-hour: since April, between 8 and 19 minutes |
| Small but capricious | Casey Jr., Star Tours, Phantom Manor, Cars ROAD TRIP | The swing is as big as what they usually post, but it’s 12-18 minutes. Place them close to where you’ll be |
| Reliable | It’s a small world, Slinky Dog, Raiponce, Cars Quatre Roues Rallye, Pirates of the Caribbean | The planned time holds. Pirates, at the end of the day, almost always at 5 minutes |
Classification based on the tables above, with data from January 1, 2024 to November 15, 2026.
- Plan first. Decide in advance at what point in the day each ride goes: that’s what saves 20-58 minutes on the big rides.
- At midday, leave slots. That’s when the most is at stake: at Disneyland Park, a 19-minute swing against 10 in the last hour.
- On the day, use the app to fine-tune. If you see a dip, decide quickly: half of them last 15 minutes or less.
- Don’t count on Frozen’s first hour. It’s its most variable stretch, and it’s the ride that opens late most often.
- When it rains, make the most of the outdoor rides. Orbitron, Dumbo, Big Thunder and RC Racer drop by 5 to 7.5 minutes.
A Note from Verónica:
In the end everything is a bit connected, and although they aren’t decisive, the rain, how often rides break down and the tastes of that day’s crowd all play a part… but lottery rides are the ones that tend to have a looooong queue all the time, though not a steady one (like Peter Pan or Crush’s Coaster). The best advice for them is the last half-hour and, to a lesser extent but sometimes also useful, the first hour.
They are perhaps the most popular rides, the ones you can’t leave without riding, which also makes them unpredictable because of the flow of visitors. For Frozen, as we’ve said many times, what has worked best for us is planning to use Single Rider. Big Thunder Mountain we usually leave for the end of the day, when the night, besides giving it a special atmosphere, can bring the queue down a lot. Two summers ago we got the surprise of a 5-minute wait and rode it 4 times in a row.
In short: plan your day and keep in mind that these rides are hard to fit in not only because their queues are long, but also because of how unpredictable they are. Make yourself a good plan and keep this in mind.
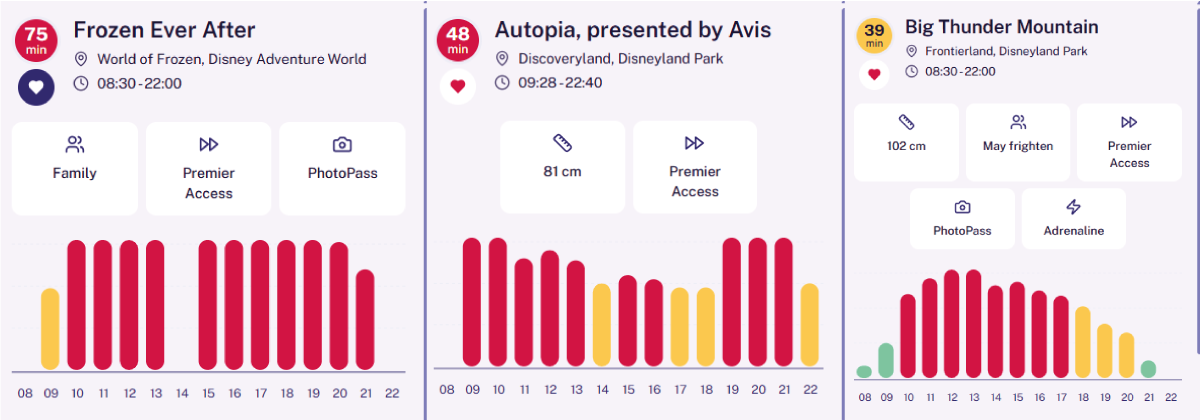
Hour-by-hour wait forecast for Frozen Ever After, Autopia and Big Thunder Mountain in MagicWait Paris, with the live wait at that moment next to each name. Red marks the hours with the longest queues; yellow and green, the shortest. At Big Thunder, the best hours are the first ones and the last.
The decision
Lottery rides exist, and we know which ones they are: Tower of Terror, Frozen, Big Thunder and Autopia. What you can’t know is whether you’ll get the good day or the bad one. That’s why the answer isn’t to improvise, but to plan better. Put the lottery rides in their best half-hour, almost always the last one, and if one has to go at midday, give it a slot with two or three options nearby instead of a fixed time. Peter Pan, at the end of the day; the reliable ones, whenever suits you. On the day, use the app to fine-tune: if a lottery ride drops and you’re close by, you have a quarter of an hour.
Want help fitting the lottery rides into your plan? Write to us at hello@magicwaitparis.com and we’ll look into it. To plan each ride at its best moment and see live whether it’s time to change the order, MagicWait Paris.